Fig. 1.
Download original image
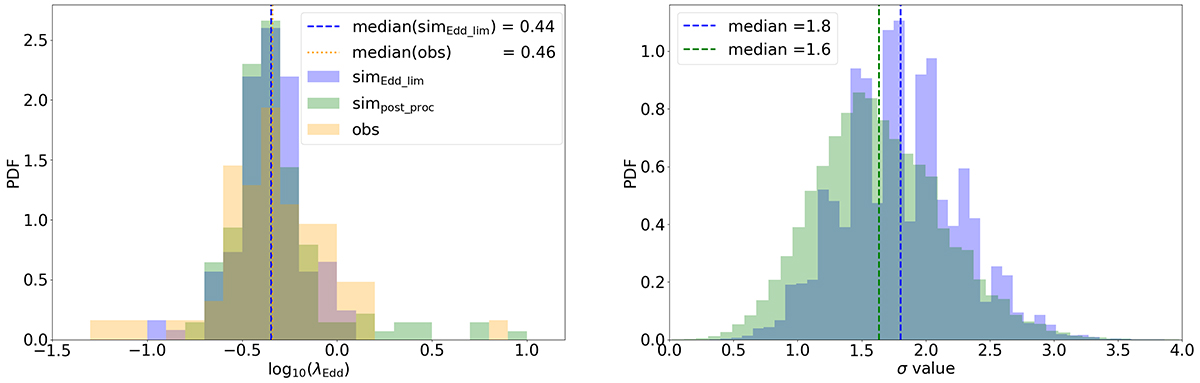
Comparison between observations of z ∼ 6 quasars and simulations. Left panel: the orange histogram shows the probability distribution function of Eddington ratios measured from the literature sample of quasars at 6 < z < 7.5. This is compared with Eddington ratio values obtained from the Eddington-limited accretion model (V21; blue histogram), and with Eddington ratio values obtained in post processing from V21 using Eq. (1) (green histogram). Right panel: distribution of the σ values obtained by applying the two-sample K–S test on Nre − samp = 106 number of resamples. The blue (green) PDF refers to the σ distribution corresponding to the original (post-processed) values of λEdd from the V21 simulation. The vertical blue and green dashed lines show the median of the blue and green distributions, respectively.
Current usage metrics show cumulative count of Article Views (full-text article views including HTML views, PDF and ePub downloads, according to the available data) and Abstracts Views on Vision4Press platform.
Data correspond to usage on the plateform after 2015. The current usage metrics is available 48-96 hours after online publication and is updated daily on week days.
Initial download of the metrics may take a while.