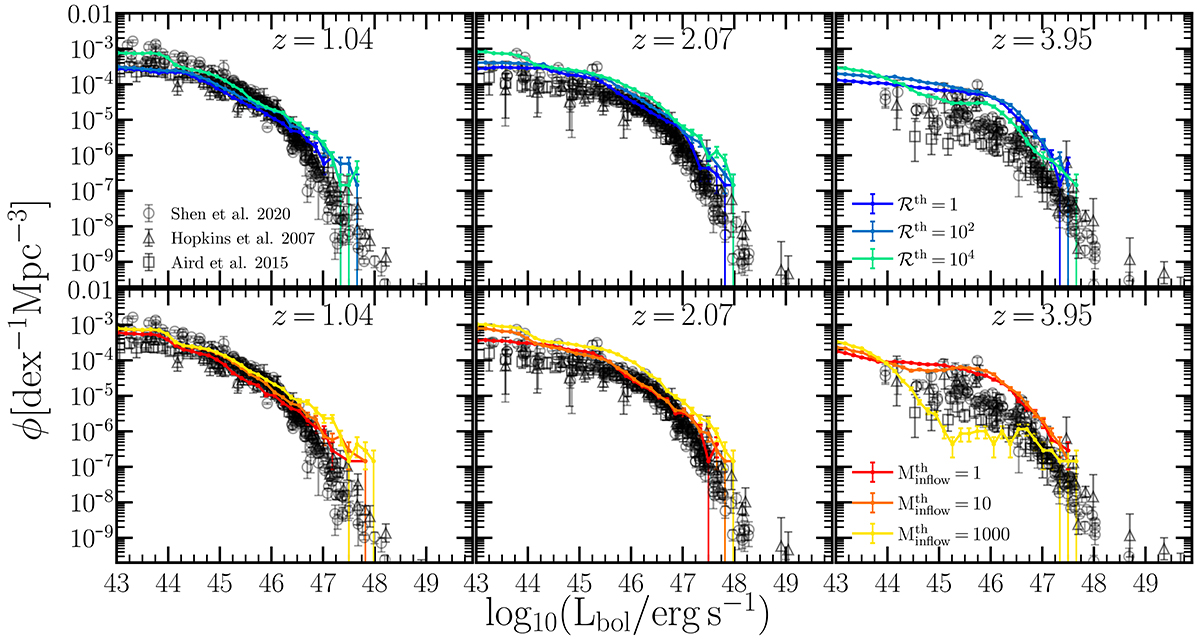
Fig. A.1.
Download original image
AGN luminosity functions at z = 1.0, 2.0, 4.0 for the model which includes super-Eddington events. The merger trees used correspond to the ones of Millennium. The error bars display the Poissionian error. The results are compared with the observations of Hopkins et al. (2007) (triangles) Aird et al. (2015) (squares) and Shen et al. (2020) (circles). The upper panels correspond to the predictions when varying ℛth and not imposing any ![]() limit. The lower ones represent the LFs of the model when changing
limit. The lower ones represent the LFs of the model when changing ![]() without any ℛth threshold.
without any ℛth threshold.
Current usage metrics show cumulative count of Article Views (full-text article views including HTML views, PDF and ePub downloads, according to the available data) and Abstracts Views on Vision4Press platform.
Data correspond to usage on the plateform after 2015. The current usage metrics is available 48-96 hours after online publication and is updated daily on week days.
Initial download of the metrics may take a while.