Fig. 7.
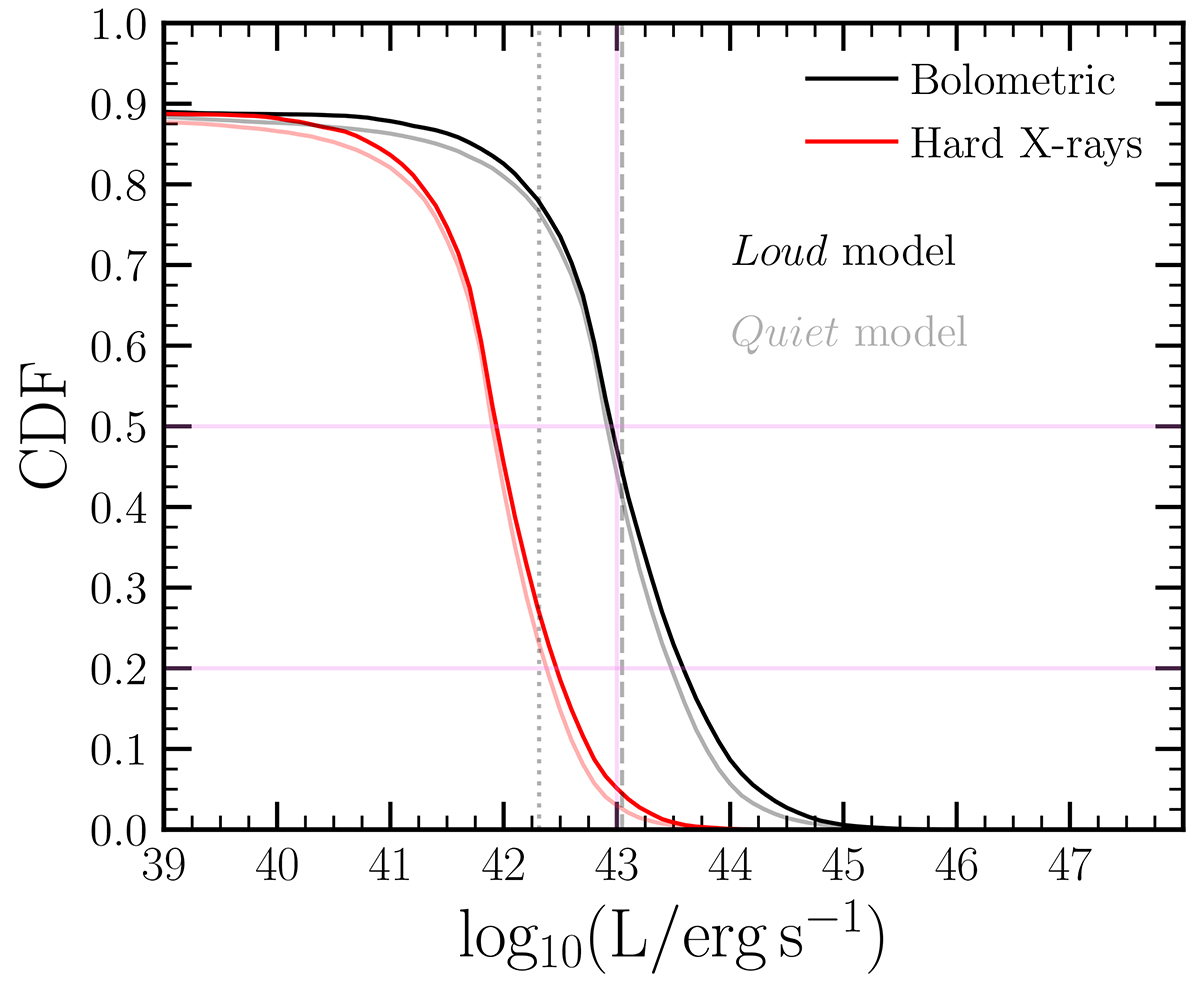
Download original image
Cumulative distribution function (CDF) of bolometric (black) and hard X-ray (2 − 10 KeV, red) luminosity of LISA detectable (S/N > 10) MBHBs with masses MBin > 105 M⊙. Darker lines correspond to the Loud model whereas the light curves depict the predictions of the Quiet one. Horizontal lines highlight the CFR values of 0.5 and 0.2. The vertical pink line highlights the luminosity value of 1043 erg s−1, while black dashed and dotted lines represent the minimum luminosity that a source must have respectively at z = 1 and z = 0.5 to be detected by Athena X-ray observatory assuming a flux limit in the hard X-ray of 2 × 10⁻¹⁵ erg s−1 cm−2 (see Lops et al. 2023).
Current usage metrics show cumulative count of Article Views (full-text article views including HTML views, PDF and ePub downloads, according to the available data) and Abstracts Views on Vision4Press platform.
Data correspond to usage on the plateform after 2015. The current usage metrics is available 48-96 hours after online publication and is updated daily on week days.
Initial download of the metrics may take a while.