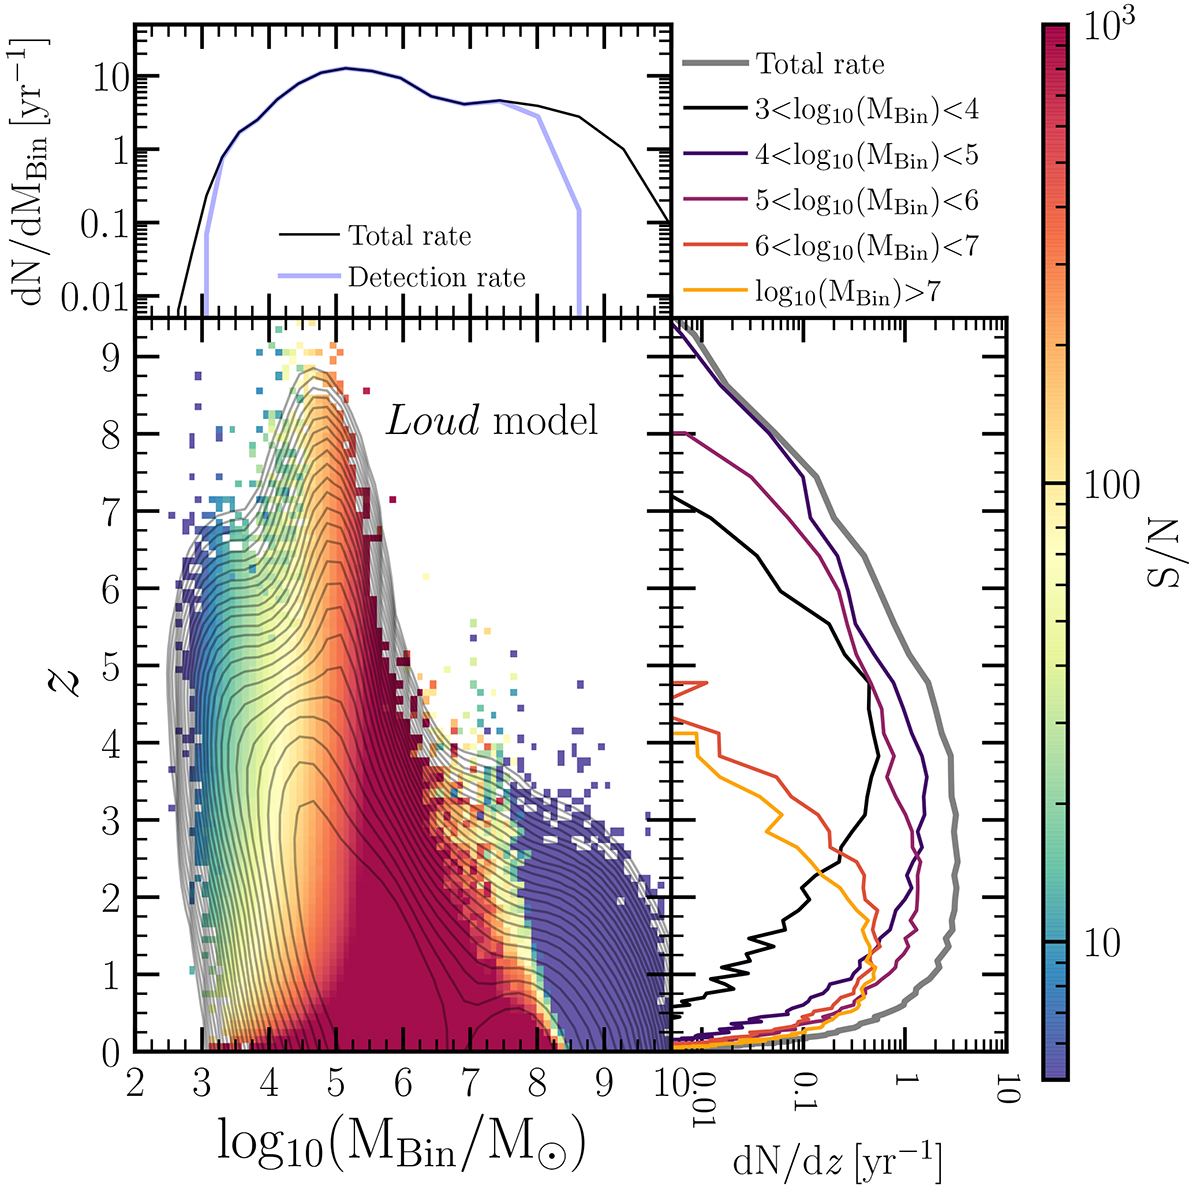
Fig. 5.
Download original image
Distribution of MBHB mergers predicted by the model Loud in the plane redshift (z) versus total rest-frame MBHB mass (MBin). Each pixel is encoded by the median signal-to-noise ratio (S/N). The contours represent the number of objects in the z − MBin plane. The small plots around the z − MBin plane correspond to the redshift (right panel) and source-frame mass (top panel) distribution of the differential number of MBHBs. In the right panel, the total distribution has been divided into 5 different mass bins.
Current usage metrics show cumulative count of Article Views (full-text article views including HTML views, PDF and ePub downloads, according to the available data) and Abstracts Views on Vision4Press platform.
Data correspond to usage on the plateform after 2015. The current usage metrics is available 48-96 hours after online publication and is updated daily on week days.
Initial download of the metrics may take a while.