Fig. 2.
Download original image
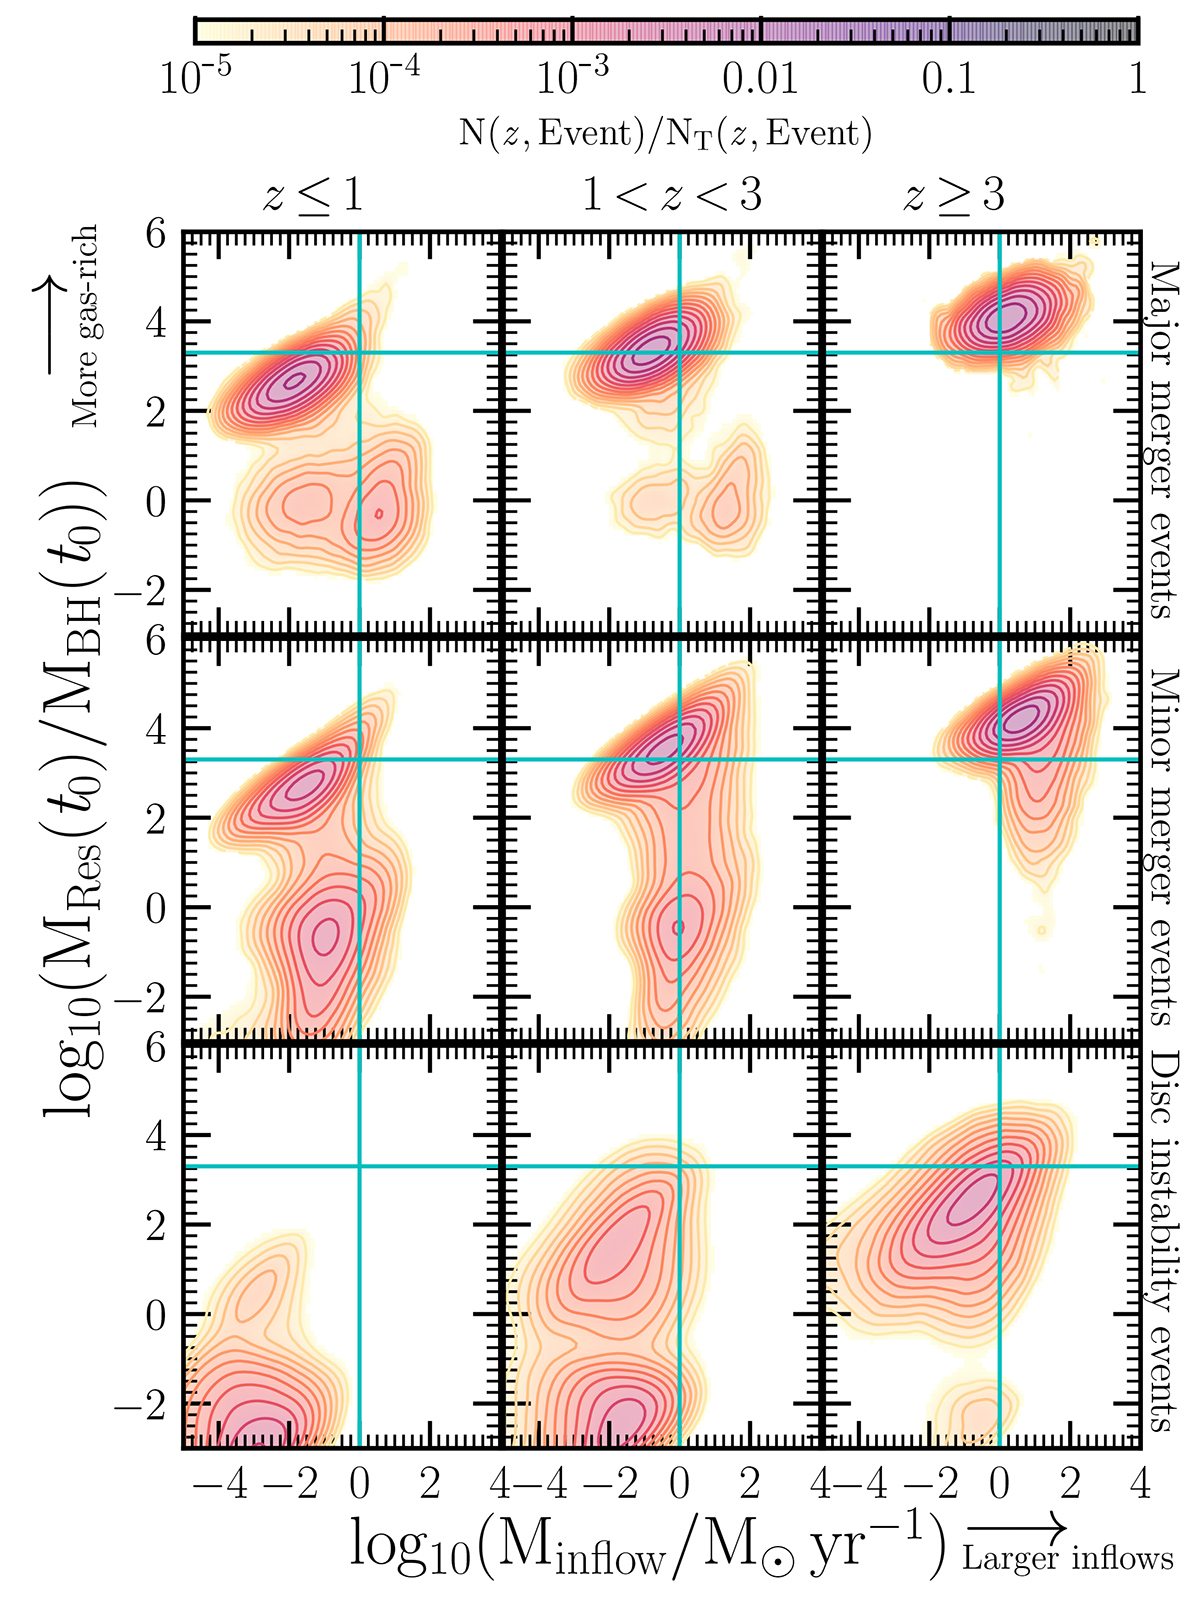
Minfolw − MRes(t0)/MBH(t0) plane in three different redshifts bins according to L-Galaxies run on the Millennium merger trees. While the y-axis depicts how gas-rich is the environment around the MBH, the x-axis illustrates how powerful are the gas inflows towards the MBH. The blue horizontal and vertical lines correspond to the chosen ℛth, and ![]() . Each row corresponds to each of the events that can trigger cold gas inflows toward the MBH: major mergers (top), minor mergers (middle) and disc instabilities (bottom). The plot has been computed by using the free parameters of the Boosted model reported in Table 1. To guide the reader, major (minor) mergers correspond to galaxy interactions which involve galaxies with baryonic masses differing by less (more) than a factor of 2.
. Each row corresponds to each of the events that can trigger cold gas inflows toward the MBH: major mergers (top), minor mergers (middle) and disc instabilities (bottom). The plot has been computed by using the free parameters of the Boosted model reported in Table 1. To guide the reader, major (minor) mergers correspond to galaxy interactions which involve galaxies with baryonic masses differing by less (more) than a factor of 2.
Current usage metrics show cumulative count of Article Views (full-text article views including HTML views, PDF and ePub downloads, according to the available data) and Abstracts Views on Vision4Press platform.
Data correspond to usage on the plateform after 2015. The current usage metrics is available 48-96 hours after online publication and is updated daily on week days.
Initial download of the metrics may take a while.