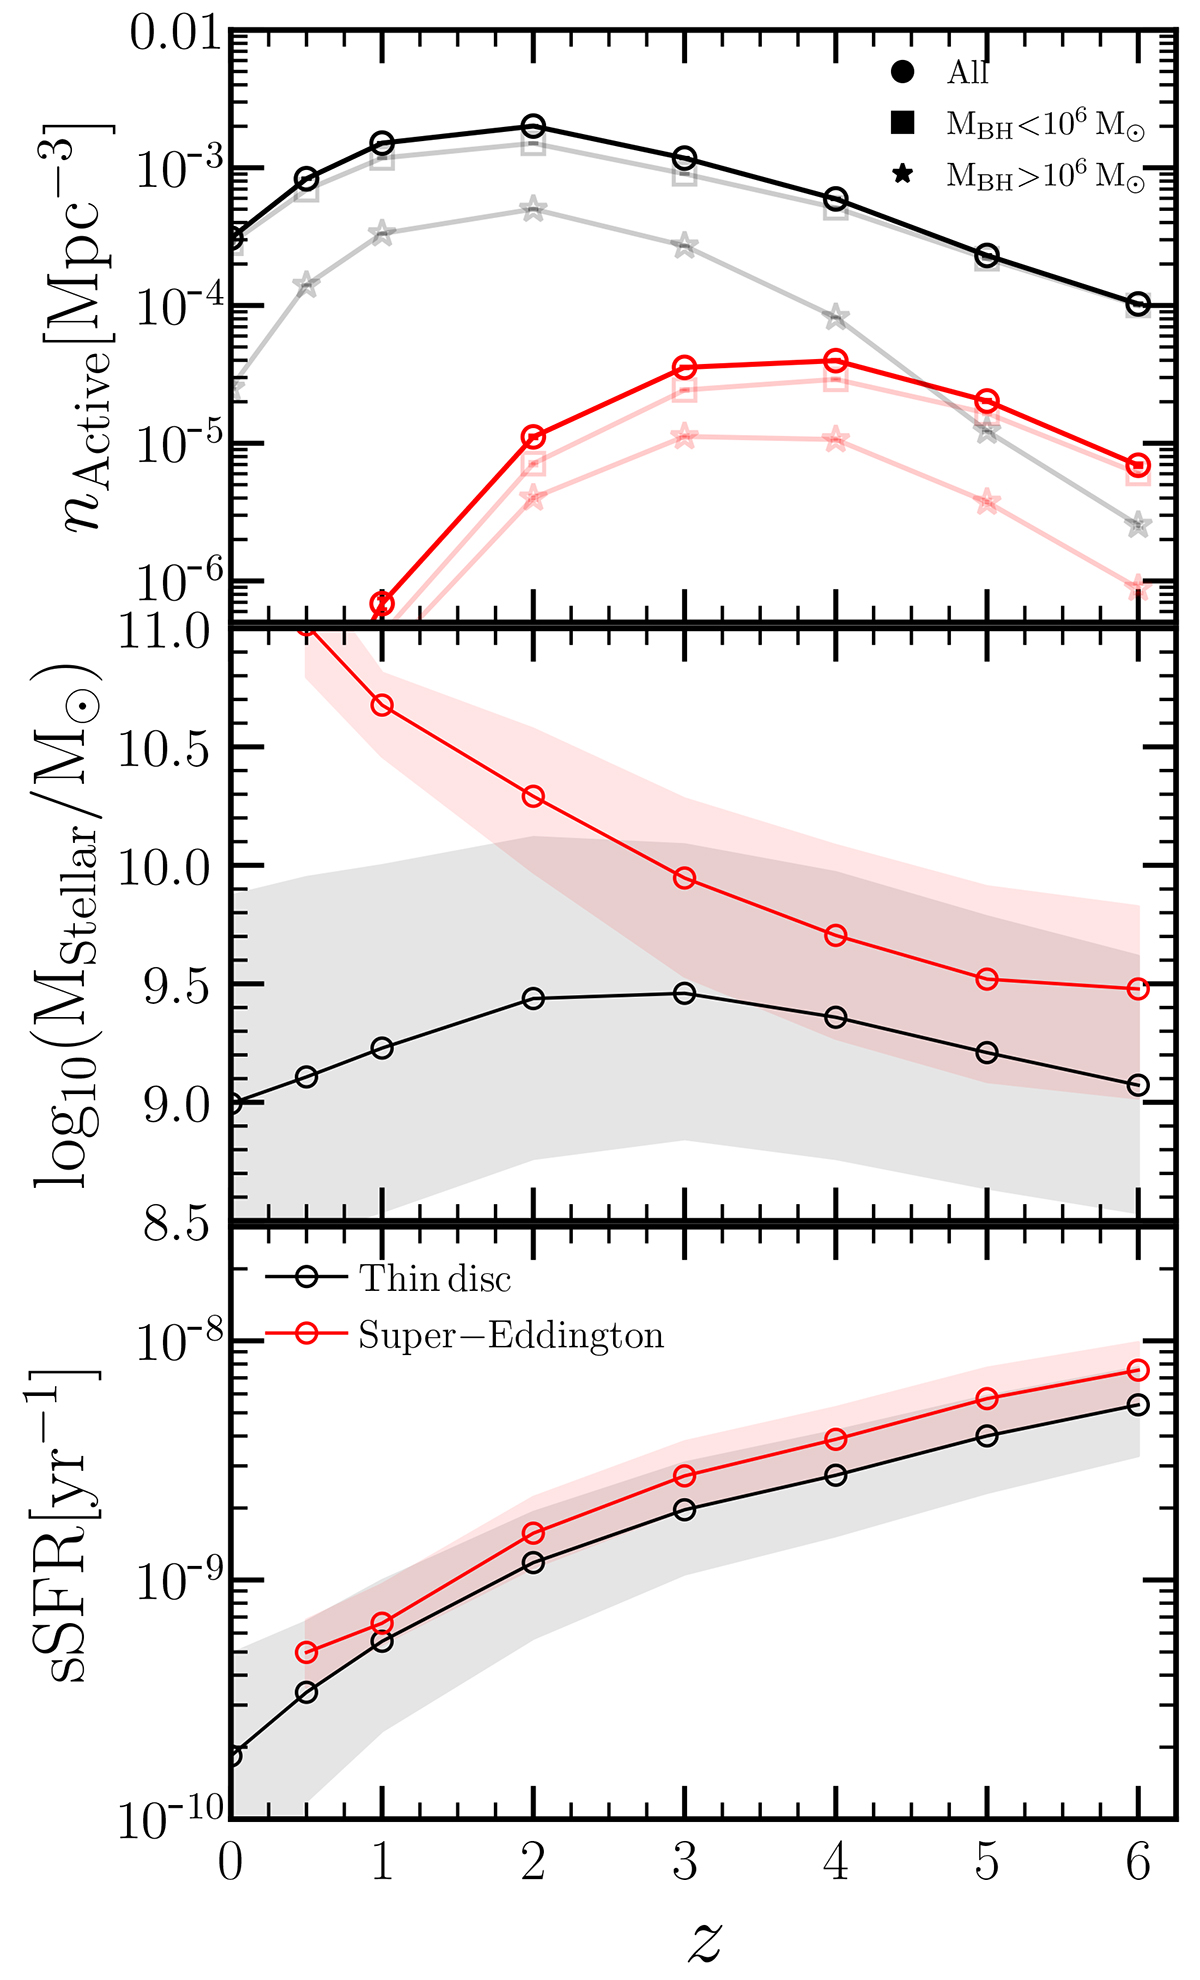
Fig. C.1.
Download original image
Comparison between the population of MBHs accreting during the thin disc mode (0.03 < fEdd ≤ 1.0) and super-Eddington (fEdd > 1). The results correspond to the ones of L-Galaxies applied on the Millennium simulation. Upper panel: Number density of AGNs accreting at super-Eddington (red) and at thin disc (black) regimen. While circles represent the whole population of AGNs, squares, and stars correspond to AGNs triggered by MBHs with MBH > 106 M⊙ and MBH < 106 M⊙, respectively. Middle and bottom panels: Median stellar mass (specific star formation rate, sSFR) of the galaxies hosting AGNs in the super-Eddington (red) and thin disc regimen (black). The shaded area corresponds to the percentile 16th–84th.
Current usage metrics show cumulative count of Article Views (full-text article views including HTML views, PDF and ePub downloads, according to the available data) and Abstracts Views on Vision4Press platform.
Data correspond to usage on the plateform after 2015. The current usage metrics is available 48-96 hours after online publication and is updated daily on week days.
Initial download of the metrics may take a while.