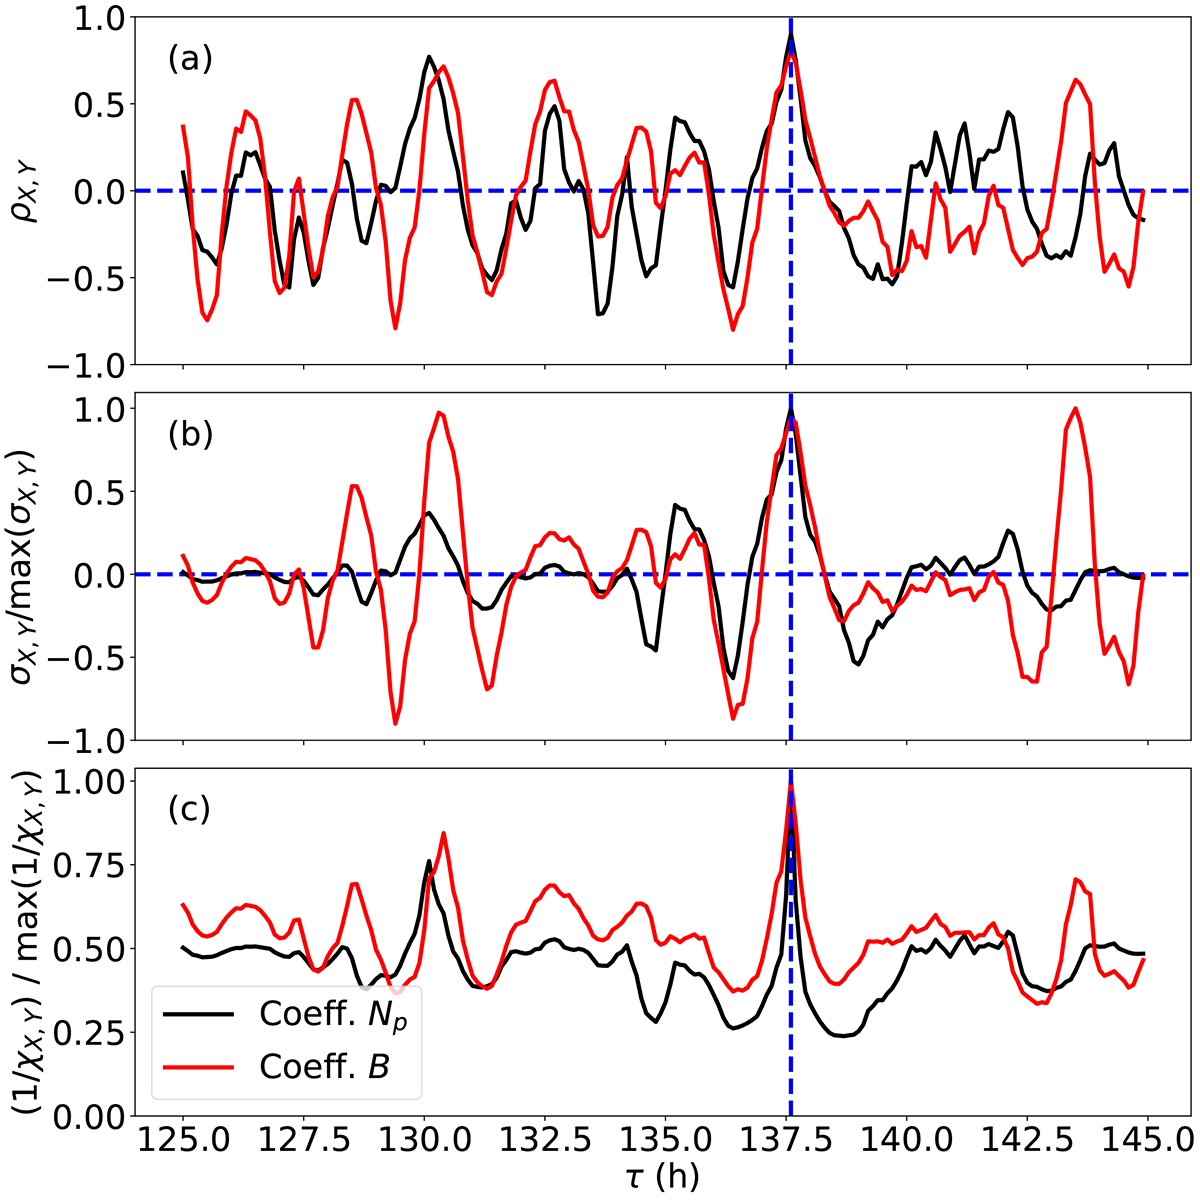
Fig. 7.
Download original image
Cross-correlation for measurements of the proton density Np (black curves) and the magnetic field magnitude B (red curves) for PSP and Solar Orbiter using different measures. Panel a shows the Pearson correlation coefficient defined by Eq. (14), panel b shows the covariance, and panel c shows 1/χX, Y defined by Eq. (17). The abscissa τ is the travel time between PSP and Solar Orbiter. The time interval considered at PSP is shown between dashed lines in Figs. 6a,c. The same time duration, 2 h, is used for the moving time window at Solar Orbiter.
Current usage metrics show cumulative count of Article Views (full-text article views including HTML views, PDF and ePub downloads, according to the available data) and Abstracts Views on Vision4Press platform.
Data correspond to usage on the plateform after 2015. The current usage metrics is available 48-96 hours after online publication and is updated daily on week days.
Initial download of the metrics may take a while.