Fig. 6.
Download original image
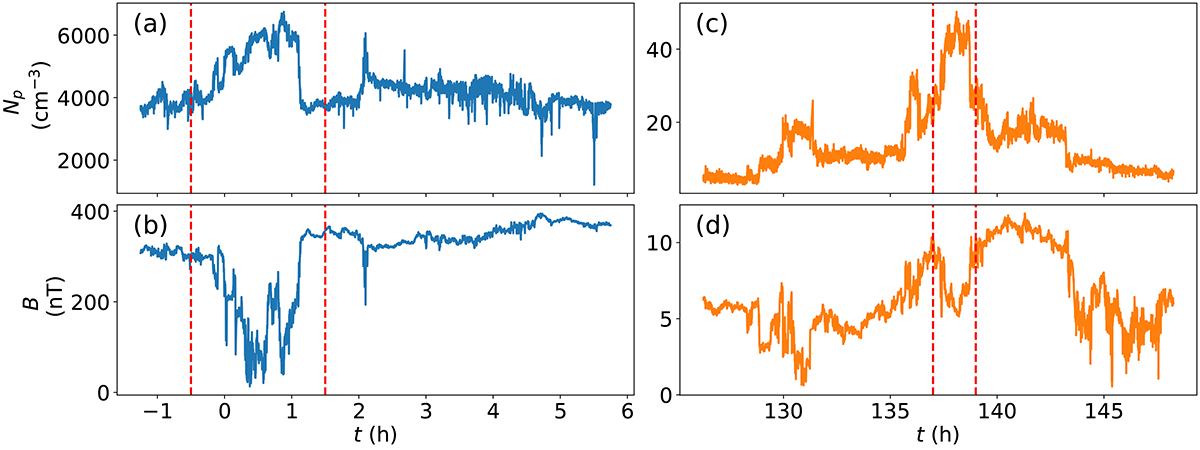
Physical parameters measured by PSP and Solar Orbiter around the predicted plasma line-up. The proton density Np is shown in panels a and c, and B, the magnitude of the magnetic field is shown in panels b and d. Blue curves (panels a and b) are PSP measurements around tin, and oranges curves (panels c and d) are Solar Orbiter measurements around tout, when the minimum distance dMIN is achieved. Density structures are indicated between two vertical dashed lines, for t ∈ [ − 0.5, 1.5] h and for t ∈ [137, 139] h, in PSP and Solar Orbiter measurements, respectively.
Current usage metrics show cumulative count of Article Views (full-text article views including HTML views, PDF and ePub downloads, according to the available data) and Abstracts Views on Vision4Press platform.
Data correspond to usage on the plateform after 2015. The current usage metrics is available 48-96 hours after online publication and is updated daily on week days.
Initial download of the metrics may take a while.