Fig. A.1.
Download original image
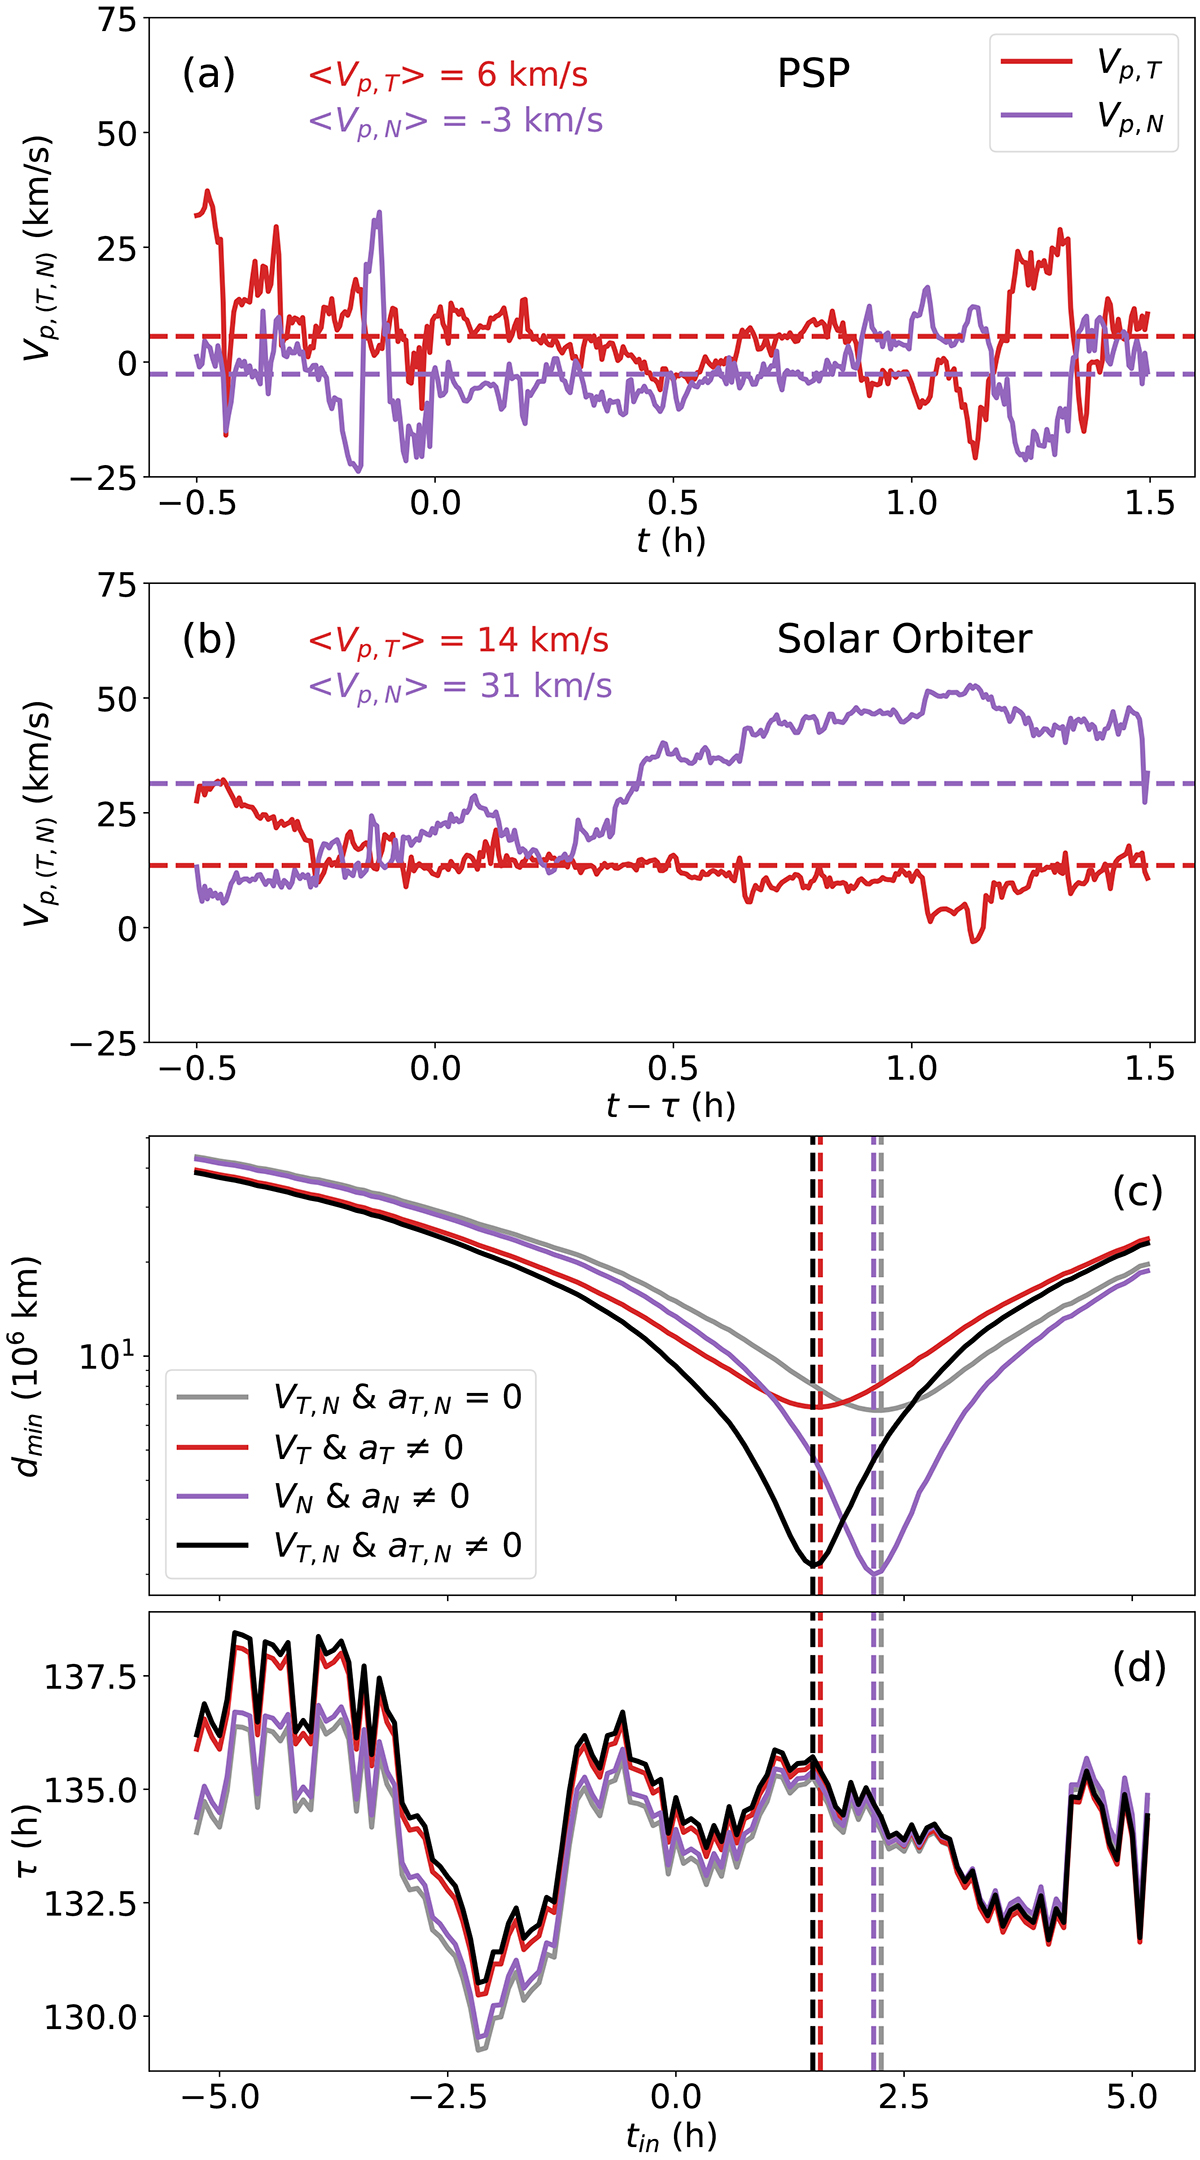
Effects of nonradial components on the predicted plasma line-up. Panels (a) and (b) show the Vp,T and Vp,N proton bulk speeds (red and purple curves, respectively) measured at PSP and Solar Orbiter for the same time intervals as in Figure 8. Panels (c) and (d) are the outcomes of the propagation method, as in Figure 5, including some nonradial components. The gray curves correspond to purely radial propagation, the red and purple curves correspond to propagation with nonzero T and N velocities and acceleration, respectively, and the black curves correspond to propagation with T and N components. For each propagation vector, the minimum distance dMIN is marked by vertical dashed lines of matching color. The radial velocities and acceleration are the same as in Figure 5.
Current usage metrics show cumulative count of Article Views (full-text article views including HTML views, PDF and ePub downloads, according to the available data) and Abstracts Views on Vision4Press platform.
Data correspond to usage on the plateform after 2015. The current usage metrics is available 48-96 hours after online publication and is updated daily on week days.
Initial download of the metrics may take a while.