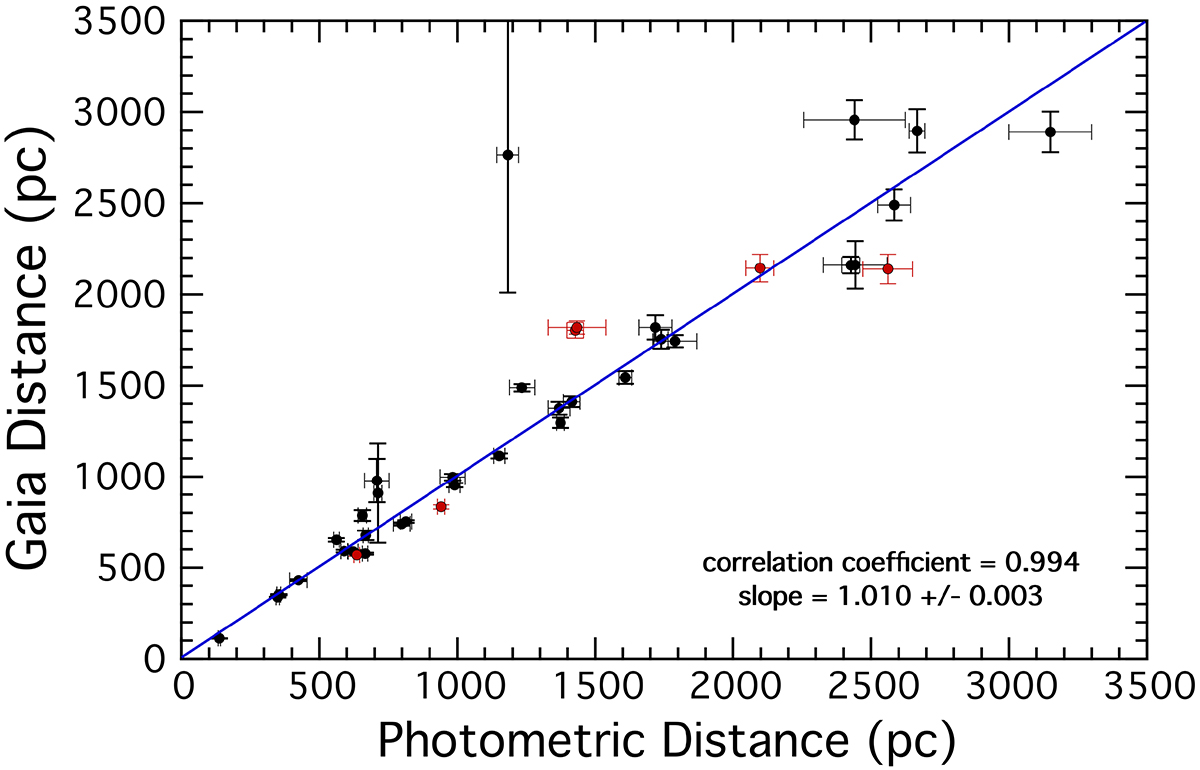
Fig. 23.
Download original image
Comparison of Gaia distances (Bailer-Jones et al. 2021) to 40 triple systems with distances found from our photodynamical fits to the system parameters. The systems marked in red are 6 from the current work with fitted distances. The blue curve is the line where the Gaia and our photometric distances would match. The formal correlation coefficient between the two sets of data is 0.993, and the fitted slope is 1.028 ± 0.004. There is one system, TIC 52041148, at a Gaia distance of 5931 ± 400 pc and photometric distance of 1357 ± 30, that is off the plot.
Current usage metrics show cumulative count of Article Views (full-text article views including HTML views, PDF and ePub downloads, according to the available data) and Abstracts Views on Vision4Press platform.
Data correspond to usage on the plateform after 2015. The current usage metrics is available 48-96 hours after online publication and is updated daily on week days.
Initial download of the metrics may take a while.