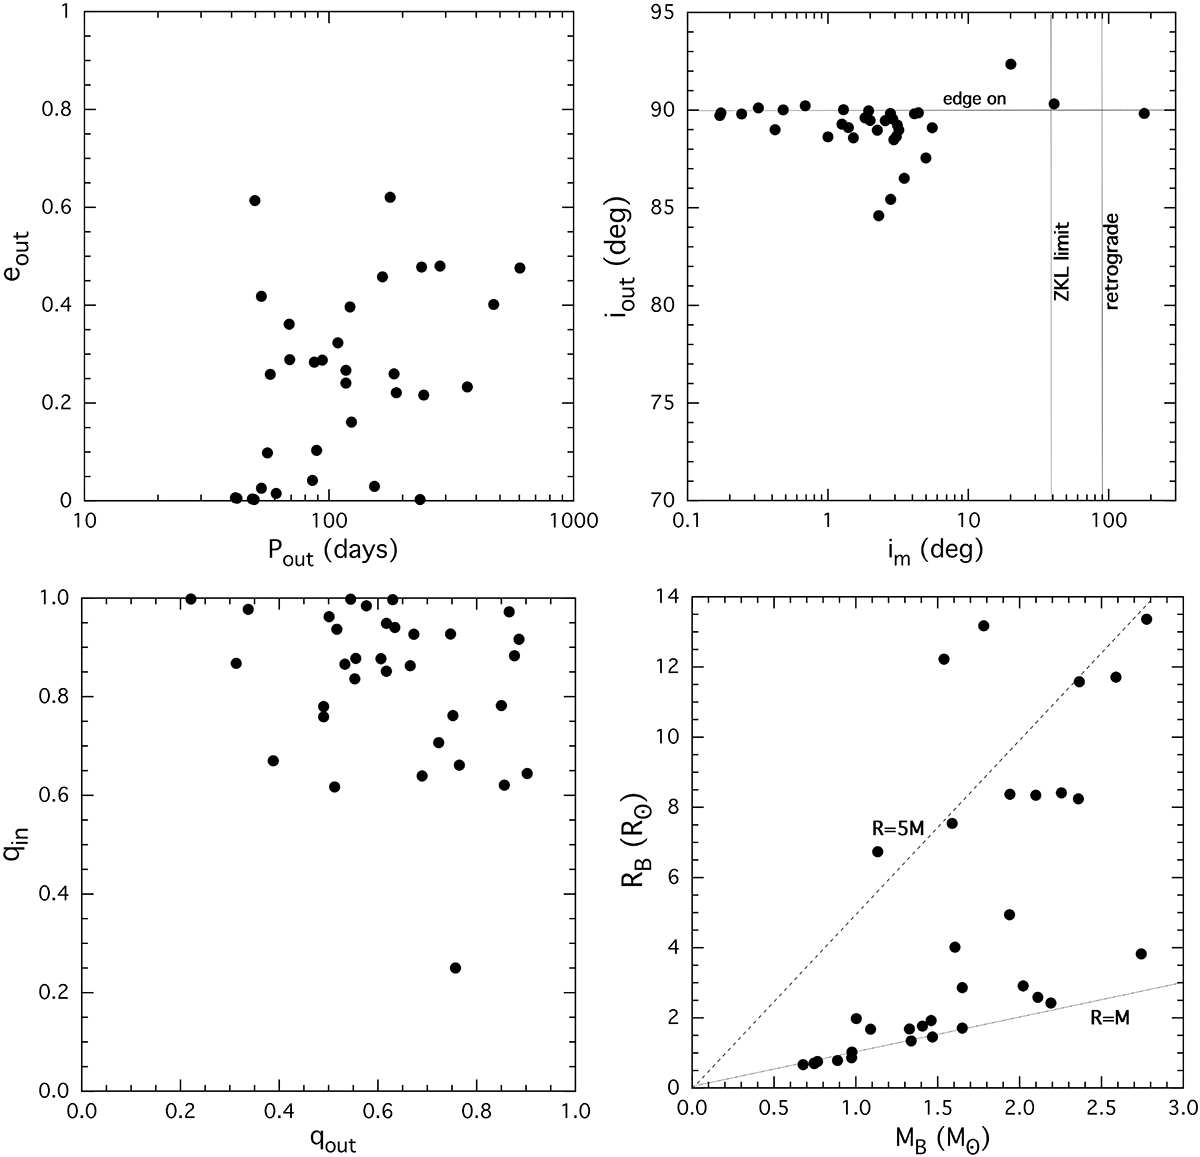
Fig. 22.
Download original image
Statistical plots for properties of 33 triply eclipsing triples uniformly analyzed (see text for references). Top-row panels: eout vs. Pout and iout vs. imut. In the upper right panel the vertical lines denote the transition to the ZLK cycles, and to retrograde orbits, respectively. Bottom-row panels: qin vs. qout and RB vs. MB. The sloped dashed lines in the latter plot are for RB = 1 MB and = 5 MB (both expressed in solar units), as rough guides of unevolved and quite evolved stars, respectively.
Current usage metrics show cumulative count of Article Views (full-text article views including HTML views, PDF and ePub downloads, according to the available data) and Abstracts Views on Vision4Press platform.
Data correspond to usage on the plateform after 2015. The current usage metrics is available 48-96 hours after online publication and is updated daily on week days.
Initial download of the metrics may take a while.