Fig. 21.
Download original image
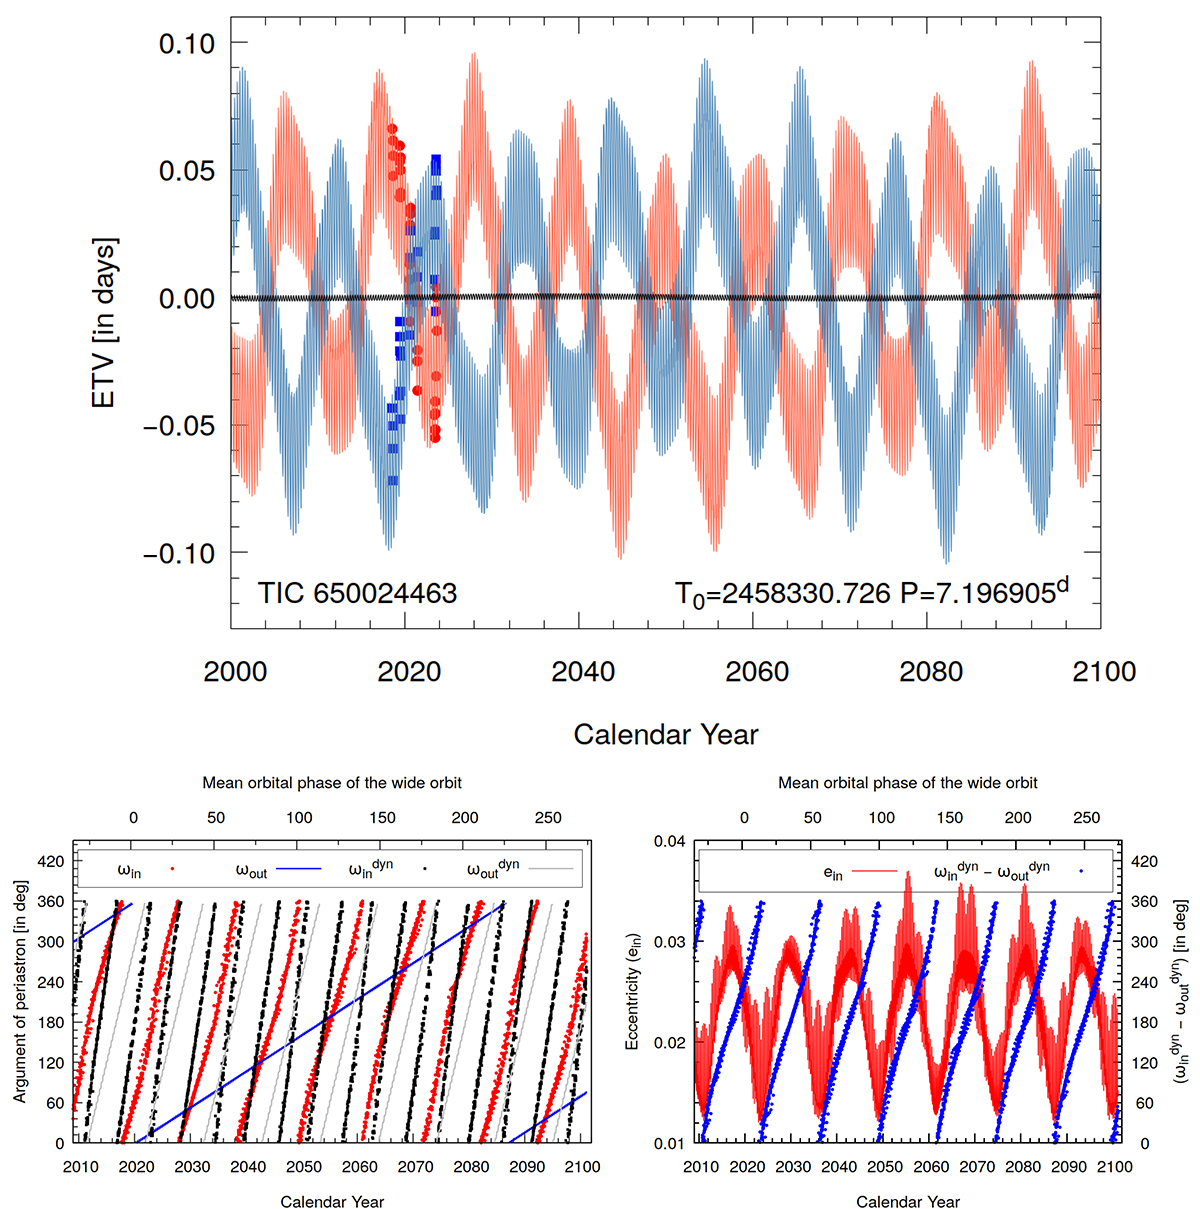
Numerically integrated models for TIC 650024463 for the entire 21st century. Upper panel: model ETV curve: red and blue lines represent the primary and secondary curves, respectively, while red circles and blue squares stand for the TESS-observed ETV points. Besides the rapidly oscillating vertical ‘spikes’, which come from the Pout period of 108 d, namely, the so-called medium term third-body perturbations, the 10.9 year third-body forced apsidal motion is also clearly visible. The amplitudes of consecutive half-cycles vary substantially which is the consequence of the octupole-order eccentricity perturbations. Lower left panel: variations of the observable and dynamical arguments of periastron (i.e., the apsidal motion of the triple) until year 2100. Lower right panel: cyclic variations of the inner eccentricity (ein – red) and the corresponding, similar-period variations of the differences of the dynamical inner and outer arguments of periastrons (![]() – blue) during the present century. See text for further details.
– blue) during the present century. See text for further details.
Current usage metrics show cumulative count of Article Views (full-text article views including HTML views, PDF and ePub downloads, according to the available data) and Abstracts Views on Vision4Press platform.
Data correspond to usage on the plateform after 2015. The current usage metrics is available 48-96 hours after online publication and is updated daily on week days.
Initial download of the metrics may take a while.