Fig. 13.
Download original image
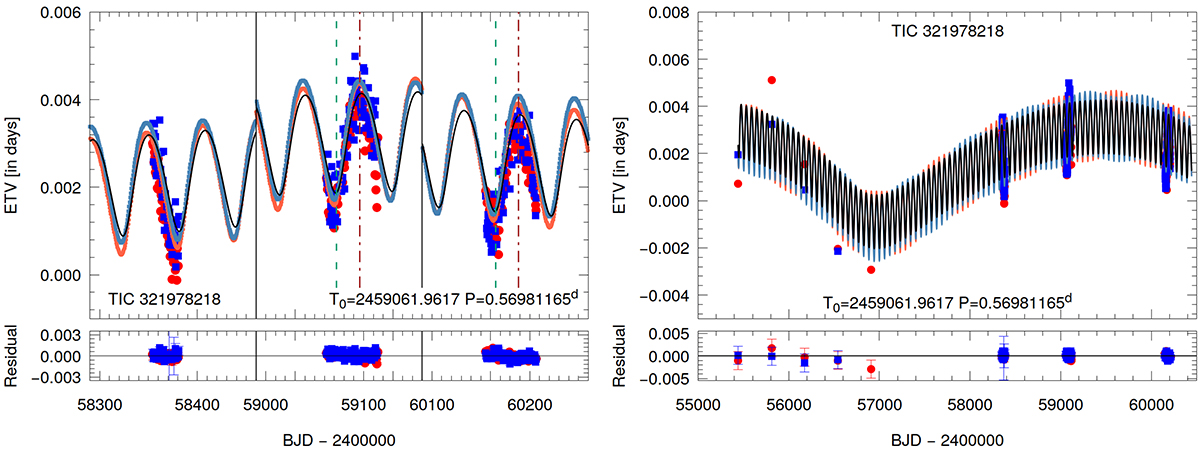
ETV curves for TIC 321978218 with the best-fit photodynamical solution superposed. Left panel: ETV curve derived from TESS data only. We note that only those sections of the ETV curves, where TESS data are available, are shown. Vertical black lines denote the different sector boundaries; dashed green lines represent the times of the observed outer eclipses when the binary occults the tertiary star, and vice versa for the dot-dashed red lines. Right panel: overall ETV curve after adding average ‘seasonal’ ETV points (see text for explanation) calculated from SWASP observations. The longer-term ETV curve also nicely shows an additional variation. We model it with an fourth stellar component, making the system a 2+1+1 quadruple. See text for details.
Current usage metrics show cumulative count of Article Views (full-text article views including HTML views, PDF and ePub downloads, according to the available data) and Abstracts Views on Vision4Press platform.
Data correspond to usage on the plateform after 2015. The current usage metrics is available 48-96 hours after online publication and is updated daily on week days.
Initial download of the metrics may take a while.