Fig. 11.
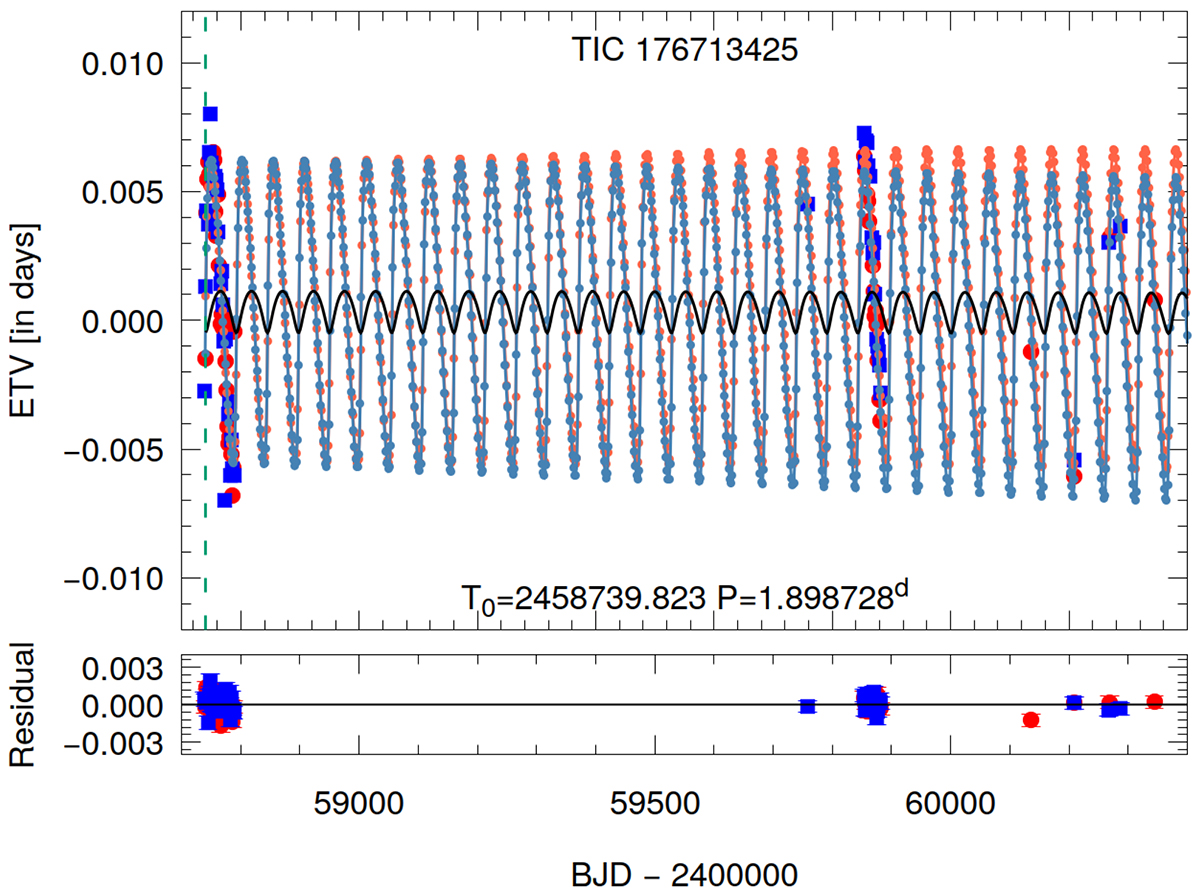
Download original image
ETV curves formed from the TESS and ground-based follow up observations with the best-fit photodynamical solution for TIC 176713425. The horizontally centered black curve represents the pure LTTE contribution. Dashed vertical green line marks the position of the only (two-dipped) third-body eclipse event which was observed with TESS.
Current usage metrics show cumulative count of Article Views (full-text article views including HTML views, PDF and ePub downloads, according to the available data) and Abstracts Views on Vision4Press platform.
Data correspond to usage on the plateform after 2015. The current usage metrics is available 48-96 hours after online publication and is updated daily on week days.
Initial download of the metrics may take a while.