Fig. 3.
Download original image
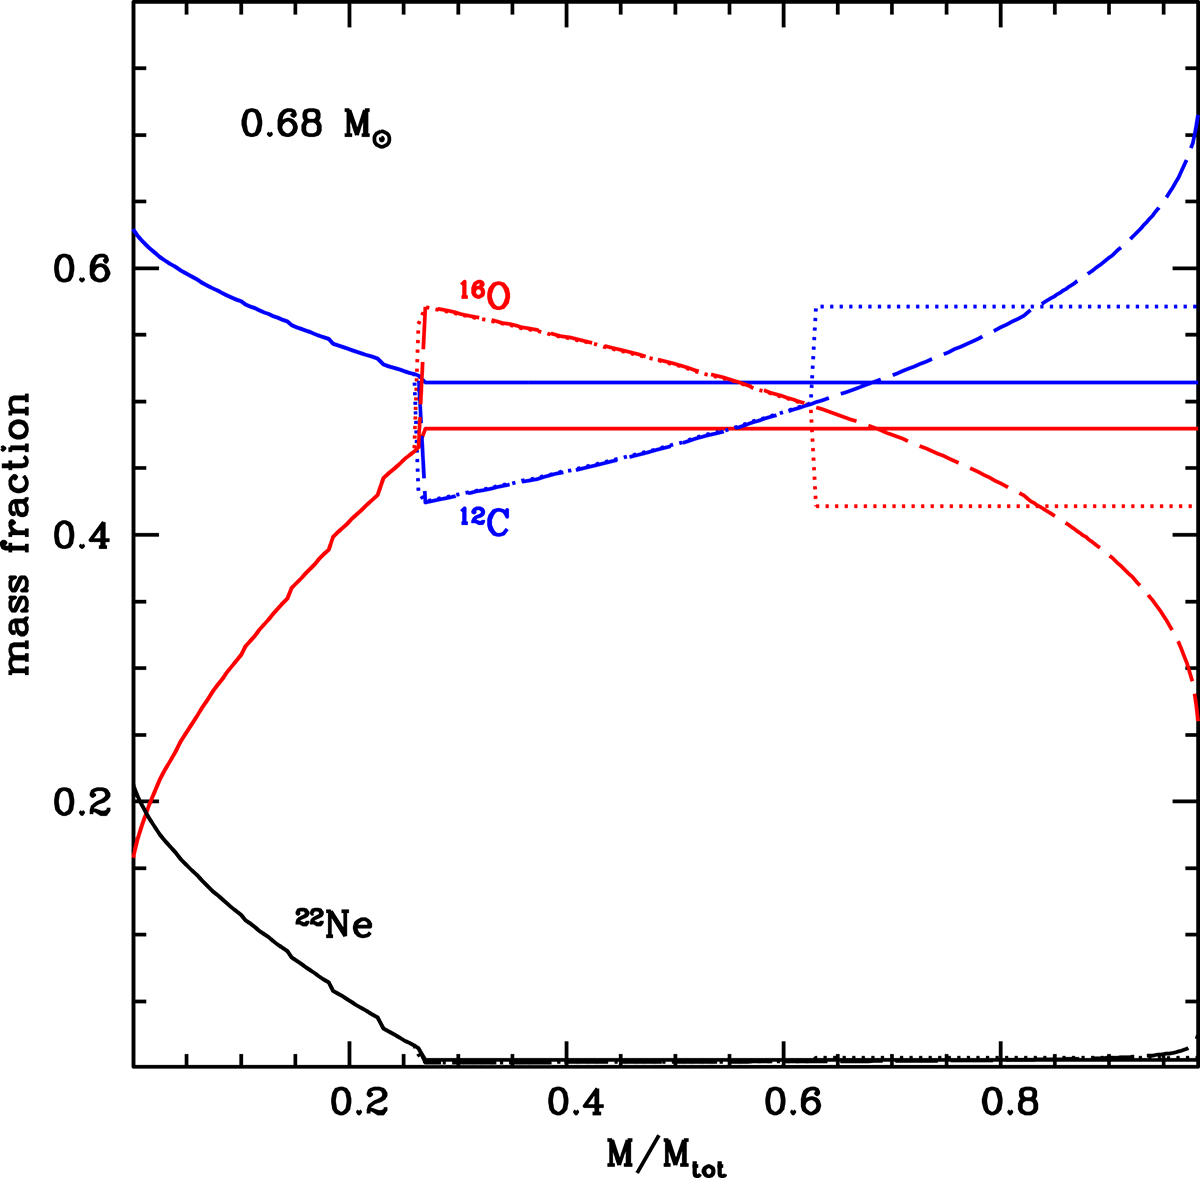
Chemical abundance profiles across 0.68 M⊙ WD models at the start of crystallization (solid lines), at the end of crystallization (dashed lines), and at an intermediate stage (dotted lines). Dotted, dashed, and solid lines overlap in the inner core, which has undergone neon distillation. Dotted and dashed lines also overlap out to M/Mtot ∼ 0.6 (see the main text for details).
Current usage metrics show cumulative count of Article Views (full-text article views including HTML views, PDF and ePub downloads, according to the available data) and Abstracts Views on Vision4Press platform.
Data correspond to usage on the plateform after 2015. The current usage metrics is available 48-96 hours after online publication and is updated daily on week days.
Initial download of the metrics may take a while.