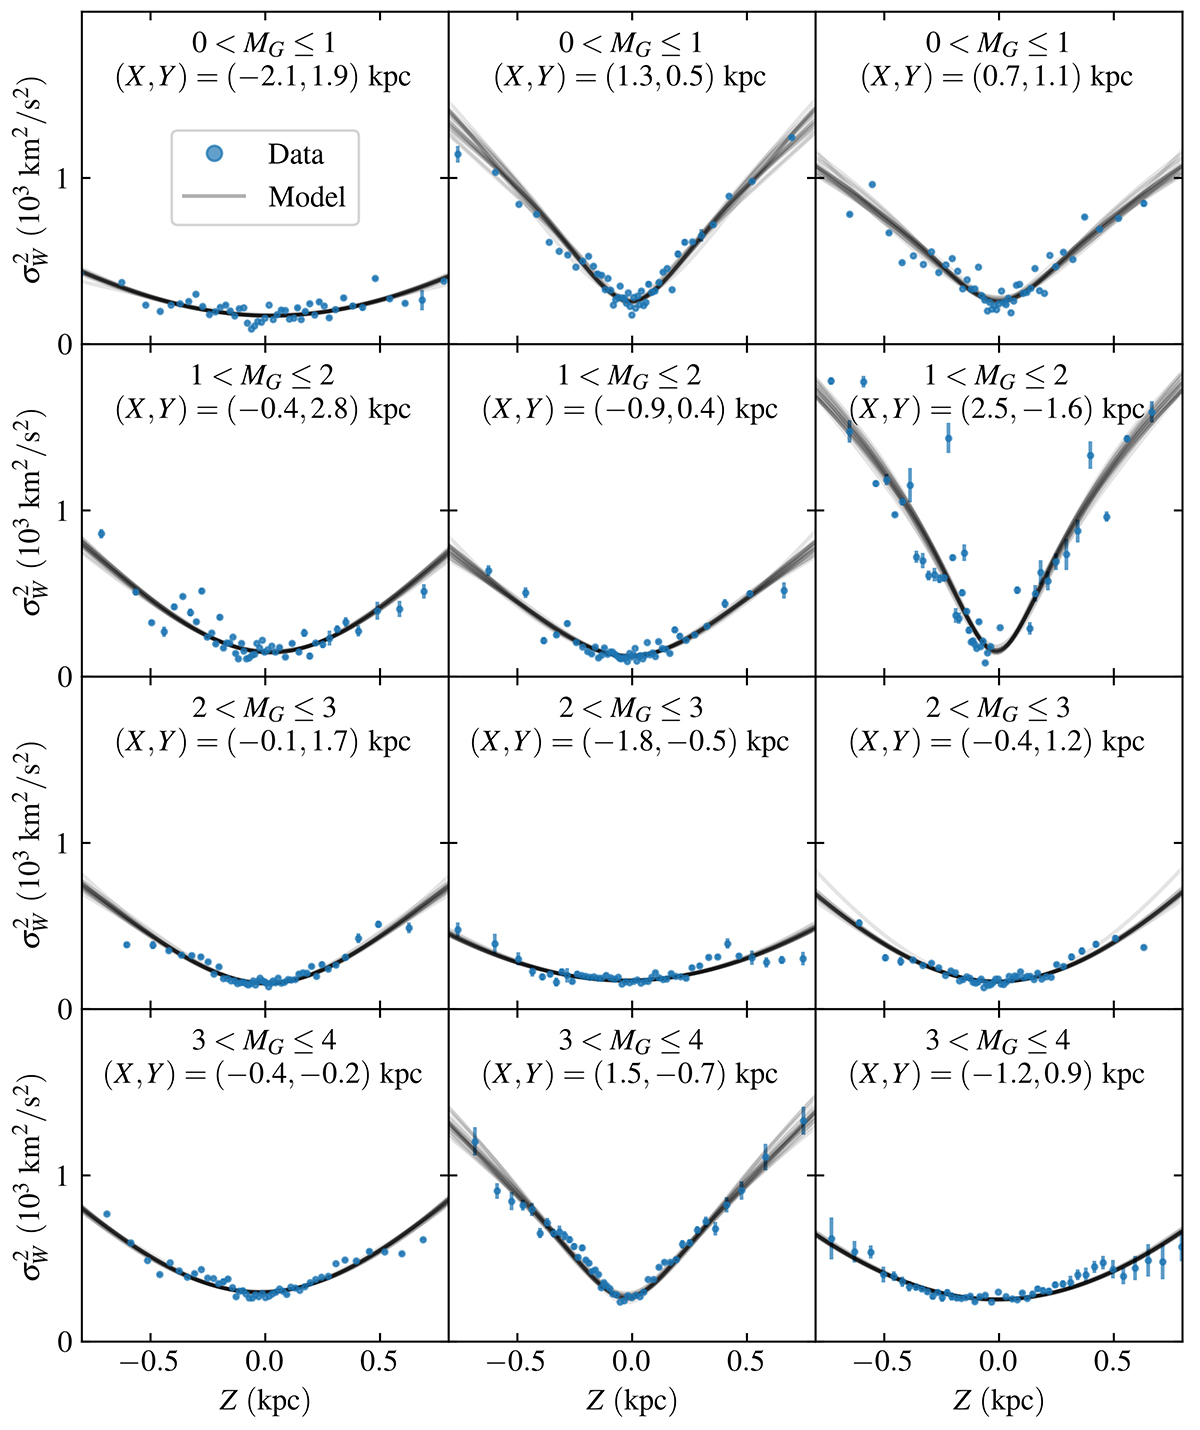
Fig. 3.
Download original image
Examples of vertical velocity dispersions and the best-fitting models (Eq. (6)). The four rows correspond to the four magnitude samples, while the three panels within each row are randomly chosen cells in the (X, Y) plane. The yellow points represent the measured velocity dispersions in adaptively spaced Z bins, while the solid lines show the best-fitting models. Note that the model is not fit to these binned dispersions, but to the individual stellar velocities. In each case, 20 sets of data and 20 models are shown, corresponding to the 20 random imputations of the dataset as described in the main text.
Current usage metrics show cumulative count of Article Views (full-text article views including HTML views, PDF and ePub downloads, according to the available data) and Abstracts Views on Vision4Press platform.
Data correspond to usage on the plateform after 2015. The current usage metrics is available 48-96 hours after online publication and is updated daily on week days.
Initial download of the metrics may take a while.