Fig. 8.
Download original image
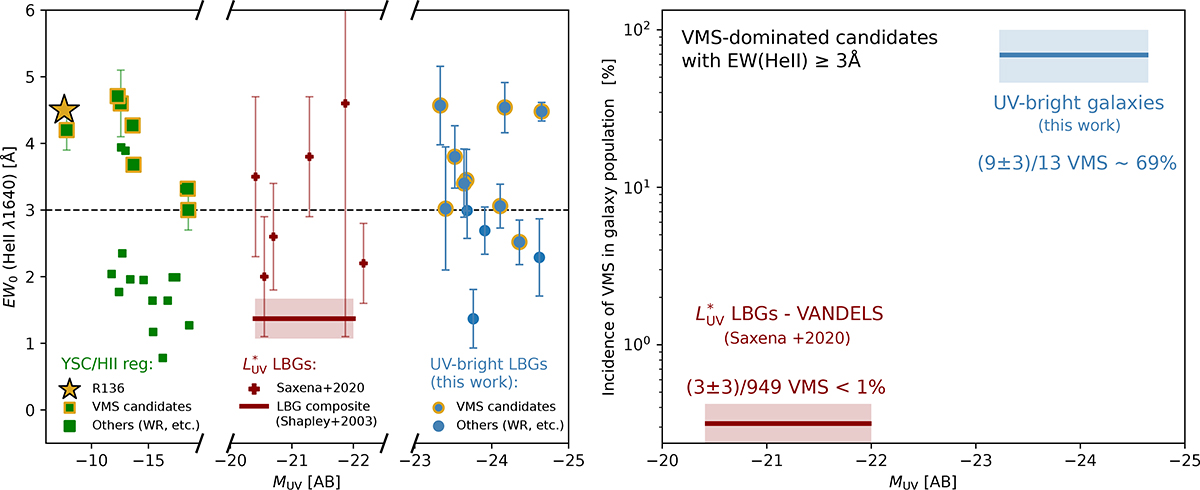
EW0 (He II) and incidence rate as a function of MUV for UV bright galaxies, along with other sources. Left: intensity of the He IIλ1640 line for different types of sources: young star clusters and H II regions (green), normal or typical (![]() ) Lyman break galaxies (red), and the UV-bright galaxies studied in this work (blue). The R136 cluster and other VMS-source candidates are marked in yellow. Right: incidence of VMS in different galaxy populations: normal LBGs in red and UV-bright galaxies in blue.
) Lyman break galaxies (red), and the UV-bright galaxies studied in this work (blue). The R136 cluster and other VMS-source candidates are marked in yellow. Right: incidence of VMS in different galaxy populations: normal LBGs in red and UV-bright galaxies in blue.
Current usage metrics show cumulative count of Article Views (full-text article views including HTML views, PDF and ePub downloads, according to the available data) and Abstracts Views on Vision4Press platform.
Data correspond to usage on the plateform after 2015. The current usage metrics is available 48-96 hours after online publication and is updated daily on week days.
Initial download of the metrics may take a while.