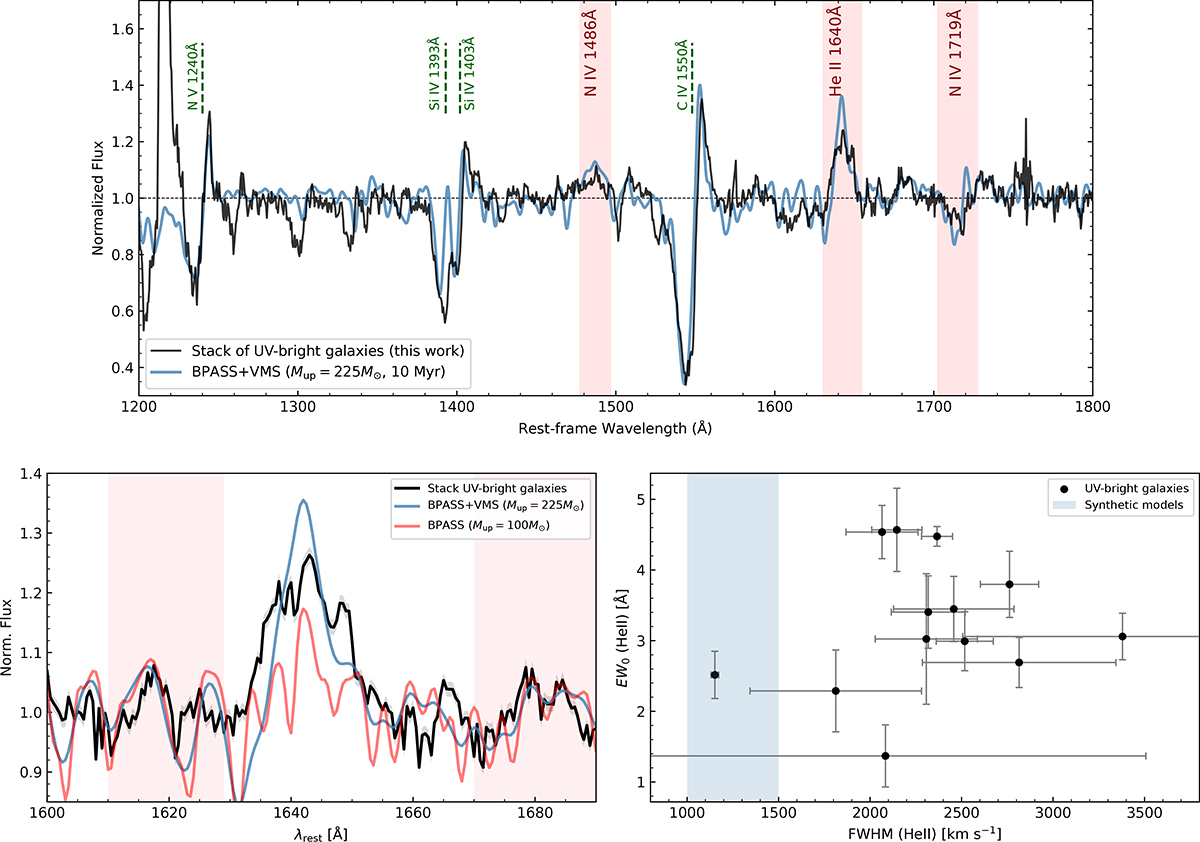
Fig. 7.
Download original image
A spectral and quantitative comparison of FWHM between the model and sources. Top panel shows the normalized composite spectrum using the 13 UV-bright sources used in this work (black). The synthetic spectrum of a BPASS+VMS model is also shown in blue and assumes an upper mass cutoff of the IMF of Mup = 225 M⊙ with a continuous star-formation over 10 Myr (using the VMS models of Martins & Palacios 2022). Spectral features associated with only VMS are marked in red while the spectral features produced by VMS and normal massive stars are marked in green. The bottom left panel shows a zoom-in at the He II line. BPASS models with and without VMS are also shown (blue and red, respectively). The bottom right panel illustrates the differences between the He II line widths (FWHM) measured in our sources (black) and model spectra (blue region).
Current usage metrics show cumulative count of Article Views (full-text article views including HTML views, PDF and ePub downloads, according to the available data) and Abstracts Views on Vision4Press platform.
Data correspond to usage on the plateform after 2015. The current usage metrics is available 48-96 hours after online publication and is updated daily on week days.
Initial download of the metrics may take a while.