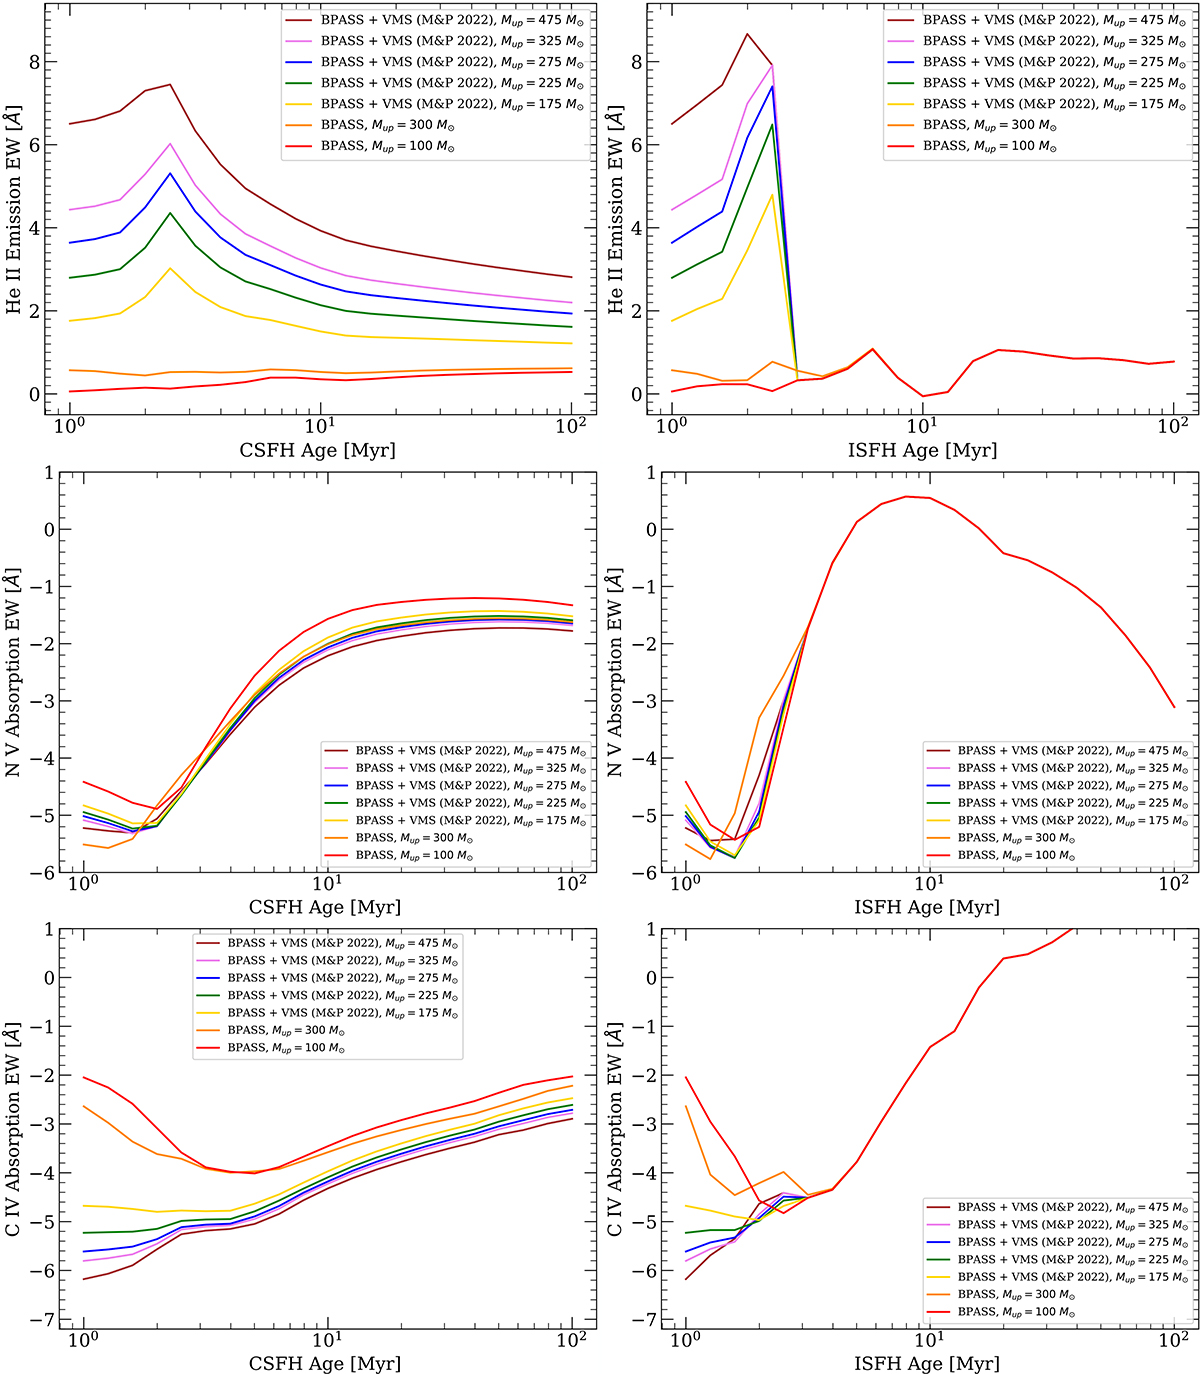
Fig. 5.
Download original image
Variation of the equivalent width (EW0) of the absorption component of the N Vλ1240 (middle), C IVλ1550 (bottom) P-Cygni line profiles and the stellar He II 1640 Å emission (top) as a function of age assuming a continuous star formation history (left) and instantaneous burst models (right). Different tracks represent models with different IMF upper mass limits (Mup). Original BPASS models with Mup = 100 M⊙ and 300 M⊙ (using the wind prescription from Vink et al. 2001) are shown in red and orange, respectively, while BPASS models with the new VMS template spectra of Martins & Palacios (2022) are shown in yellow, green, blue, pink, and brown for Mup = 175 M⊙, 225 M⊙, 275 M⊙, 325 M⊙, and 475 M⊙ respectively.
Current usage metrics show cumulative count of Article Views (full-text article views including HTML views, PDF and ePub downloads, according to the available data) and Abstracts Views on Vision4Press platform.
Data correspond to usage on the plateform after 2015. The current usage metrics is available 48-96 hours after online publication and is updated daily on week days.
Initial download of the metrics may take a while.