Fig. 4.
Download original image
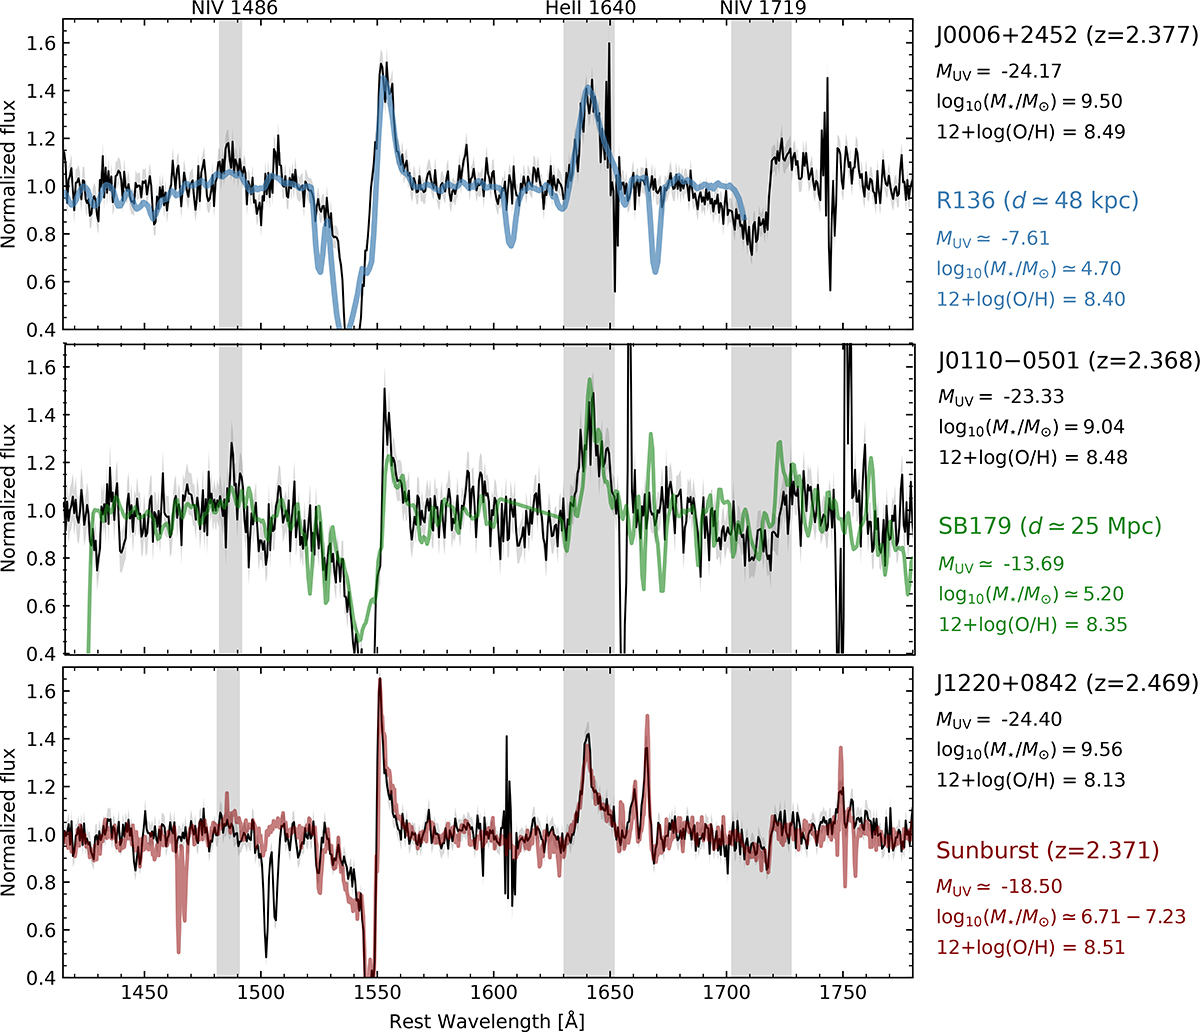
Comparison of the normalized GTC rest-UV spectrum of some of our sources with star clusters containing VMS (R136 in blue: Crowther et al. 2016; SB 179 in green: Senchyna et al. 2017; and the Sunburst cluster in red: Meštrić et al. 2023). Gray-shaded regions mark the location of the most important spectral features associated with VMS: broad emission in N IVλ1486 and He IIλ1640, and a P-Cygni line profile in N IVλ1719. Some physical properties of these systems, including MUV, stellar mass, and metallicity, are also shown (see text for details).
Current usage metrics show cumulative count of Article Views (full-text article views including HTML views, PDF and ePub downloads, according to the available data) and Abstracts Views on Vision4Press platform.
Data correspond to usage on the plateform after 2015. The current usage metrics is available 48-96 hours after online publication and is updated daily on week days.
Initial download of the metrics may take a while.