Fig. 3.
Download original image
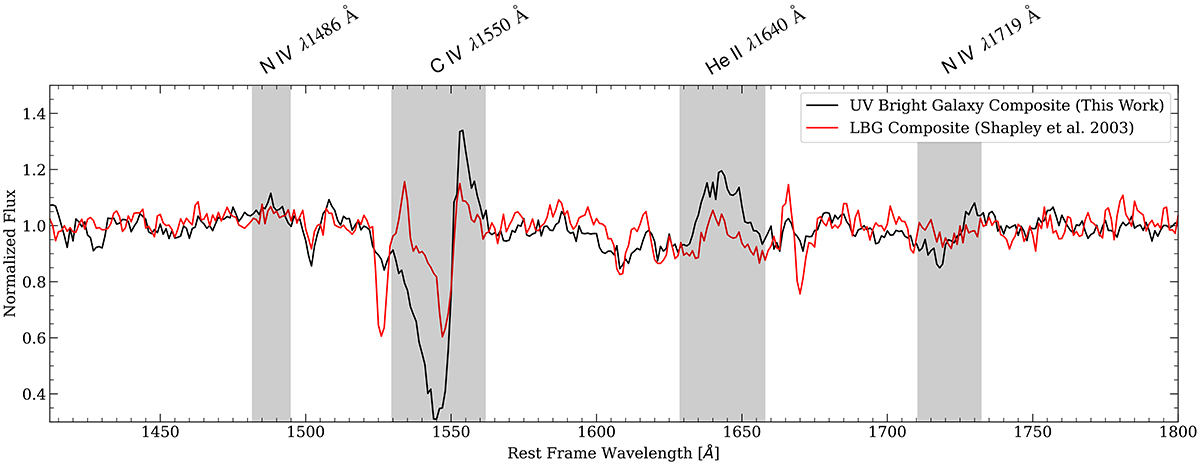
Comparison between our composite spectrum of UV-bright galaxies (black) and that of typical (![]() ) Lyman break galaxies at z ∼ 3 from Shapley et al. (2003) (red). Measurements of the EW0 (He II) for both composites are shown in the caption. The region near the He IIλ1640 emission profile is normalized with a different normalization factor to match the level of the continuum. The measured EW0 (He II) for the composite of UV bright galaxies in this work is 3.19 ± 0.07 Å while for the Shapley composite is 1.37 Å.
) Lyman break galaxies at z ∼ 3 from Shapley et al. (2003) (red). Measurements of the EW0 (He II) for both composites are shown in the caption. The region near the He IIλ1640 emission profile is normalized with a different normalization factor to match the level of the continuum. The measured EW0 (He II) for the composite of UV bright galaxies in this work is 3.19 ± 0.07 Å while for the Shapley composite is 1.37 Å.
Current usage metrics show cumulative count of Article Views (full-text article views including HTML views, PDF and ePub downloads, according to the available data) and Abstracts Views on Vision4Press platform.
Data correspond to usage on the plateform after 2015. The current usage metrics is available 48-96 hours after online publication and is updated daily on week days.
Initial download of the metrics may take a while.