Fig. 1.
Download original image
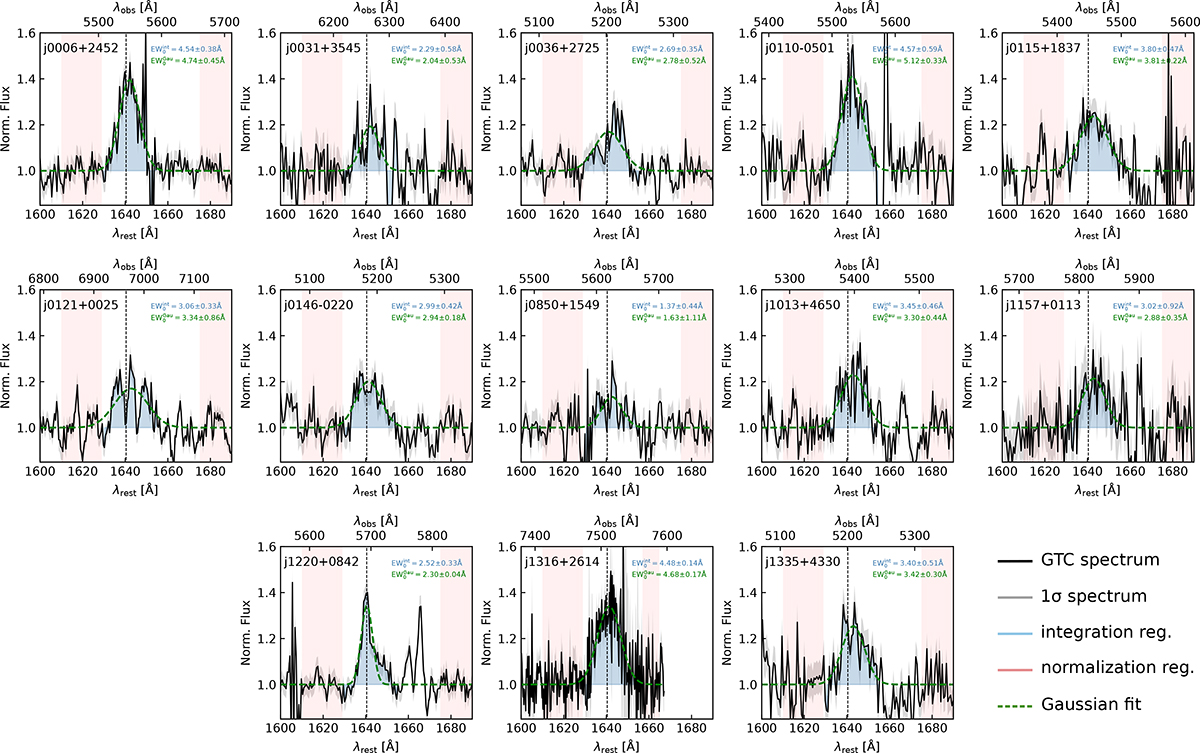
Normalized GTC spectra of the 13 UV-bright galaxies studied in this work around the He IIλ1640 line (black, and 1σ uncertainty in gray). Spectra are normalized using the continuum regions marked in red. Equivalent widths of the He II line are measured by integrating the spectral regions from 1630 Å to 1655 Å (blue regions). Green dashed lines show Gaussian fits of the He IIλ1640 emission. The x-axes represent the rest-frame and observed wavelengths (bottom and top axis, respectively).
Current usage metrics show cumulative count of Article Views (full-text article views including HTML views, PDF and ePub downloads, according to the available data) and Abstracts Views on Vision4Press platform.
Data correspond to usage on the plateform after 2015. The current usage metrics is available 48-96 hours after online publication and is updated daily on week days.
Initial download of the metrics may take a while.