Fig. 19.
Download original image
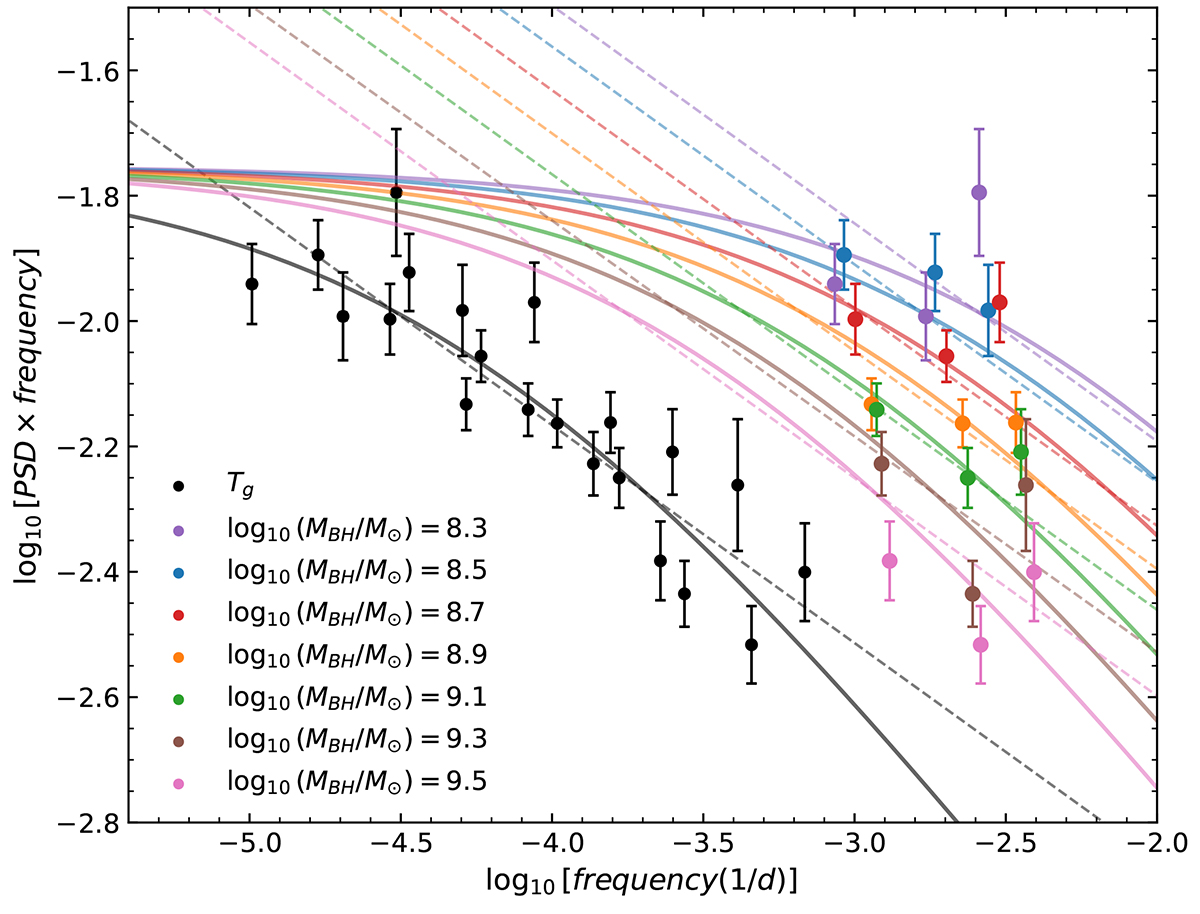
Ensemble PSDs of quasars with λrest = 3000 Å, log(λEdd) = − 1.0 and various MBH (points with different colours on the plot). Black points indicate the universal PSD of all the quasars, computed when light curves are normalized with the gravitational timescale, Tg. Black dashed and solid lines show the best-fit single and bending power law models to the black points, respectively. Coloured lines show the same best-fit models re-scaled in frequency by 1/Tg, for each of the BH mass listed in the bottom left part of the plot (see Sect. 5.2 for details).
Current usage metrics show cumulative count of Article Views (full-text article views including HTML views, PDF and ePub downloads, according to the available data) and Abstracts Views on Vision4Press platform.
Data correspond to usage on the plateform after 2015. The current usage metrics is available 48-96 hours after online publication and is updated daily on week days.
Initial download of the metrics may take a while.