Fig. A.3
Download original image
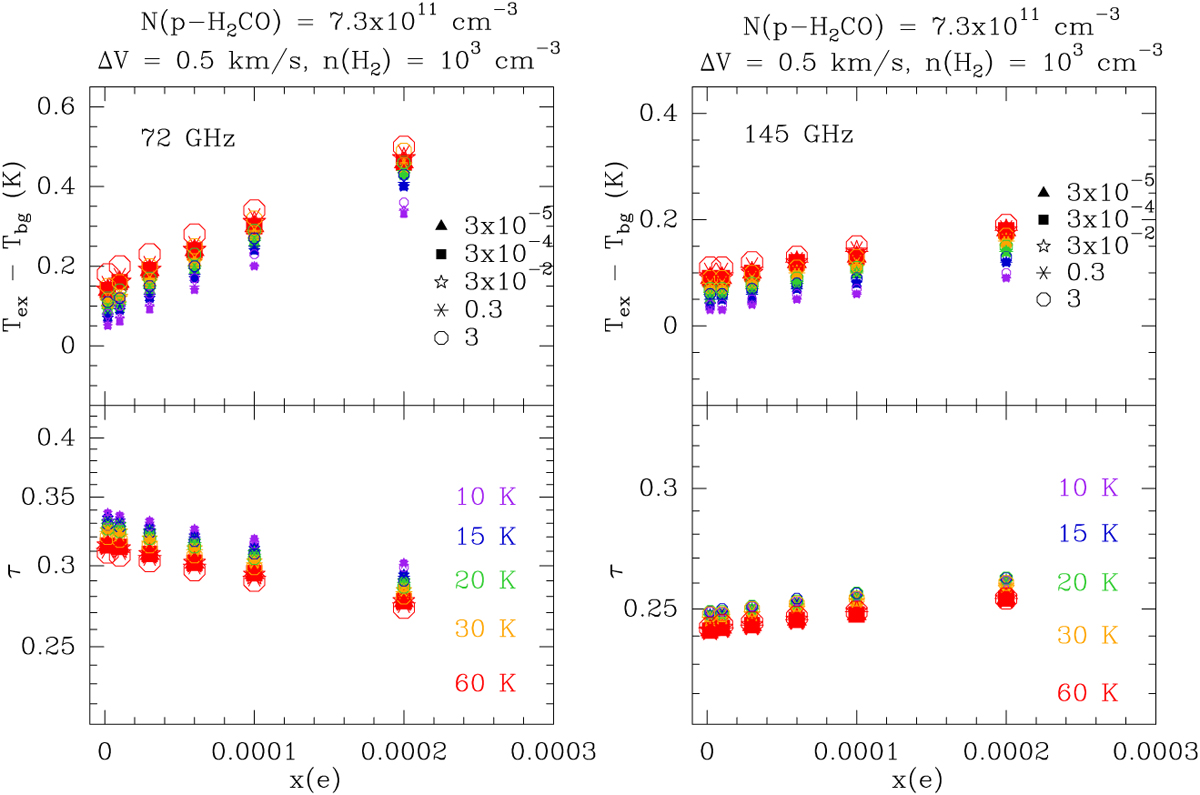
Variation of the excitation temperature and opacity for the l0,1 − 00,0 line at 72 GHz (left), and the 20,2 − 10,1 line at 145 GHz (right) with the electron fraction, kinetic temperature, and H2 ortho-to-para ratio. The difference between the excitation temperature and the CMB is plotted. Different symbols show the values of the H2 ortho-to-para ratio between 3 × 10⁻⁵ and 3, their color and size indicate the kinetic temperature between 10 K and 60 K. The column density of p-H2CO is 7.3 × 1011 cm-2, the H2 density is set to 103 cm-3, and the line FWHM is 0.5 km s-1. The 10,1 − 00,0 line at 72 GHz has not been observed in this work.
Current usage metrics show cumulative count of Article Views (full-text article views including HTML views, PDF and ePub downloads, according to the available data) and Abstracts Views on Vision4Press platform.
Data correspond to usage on the plateform after 2015. The current usage metrics is available 48-96 hours after online publication and is updated daily on week days.
Initial download of the metrics may take a while.