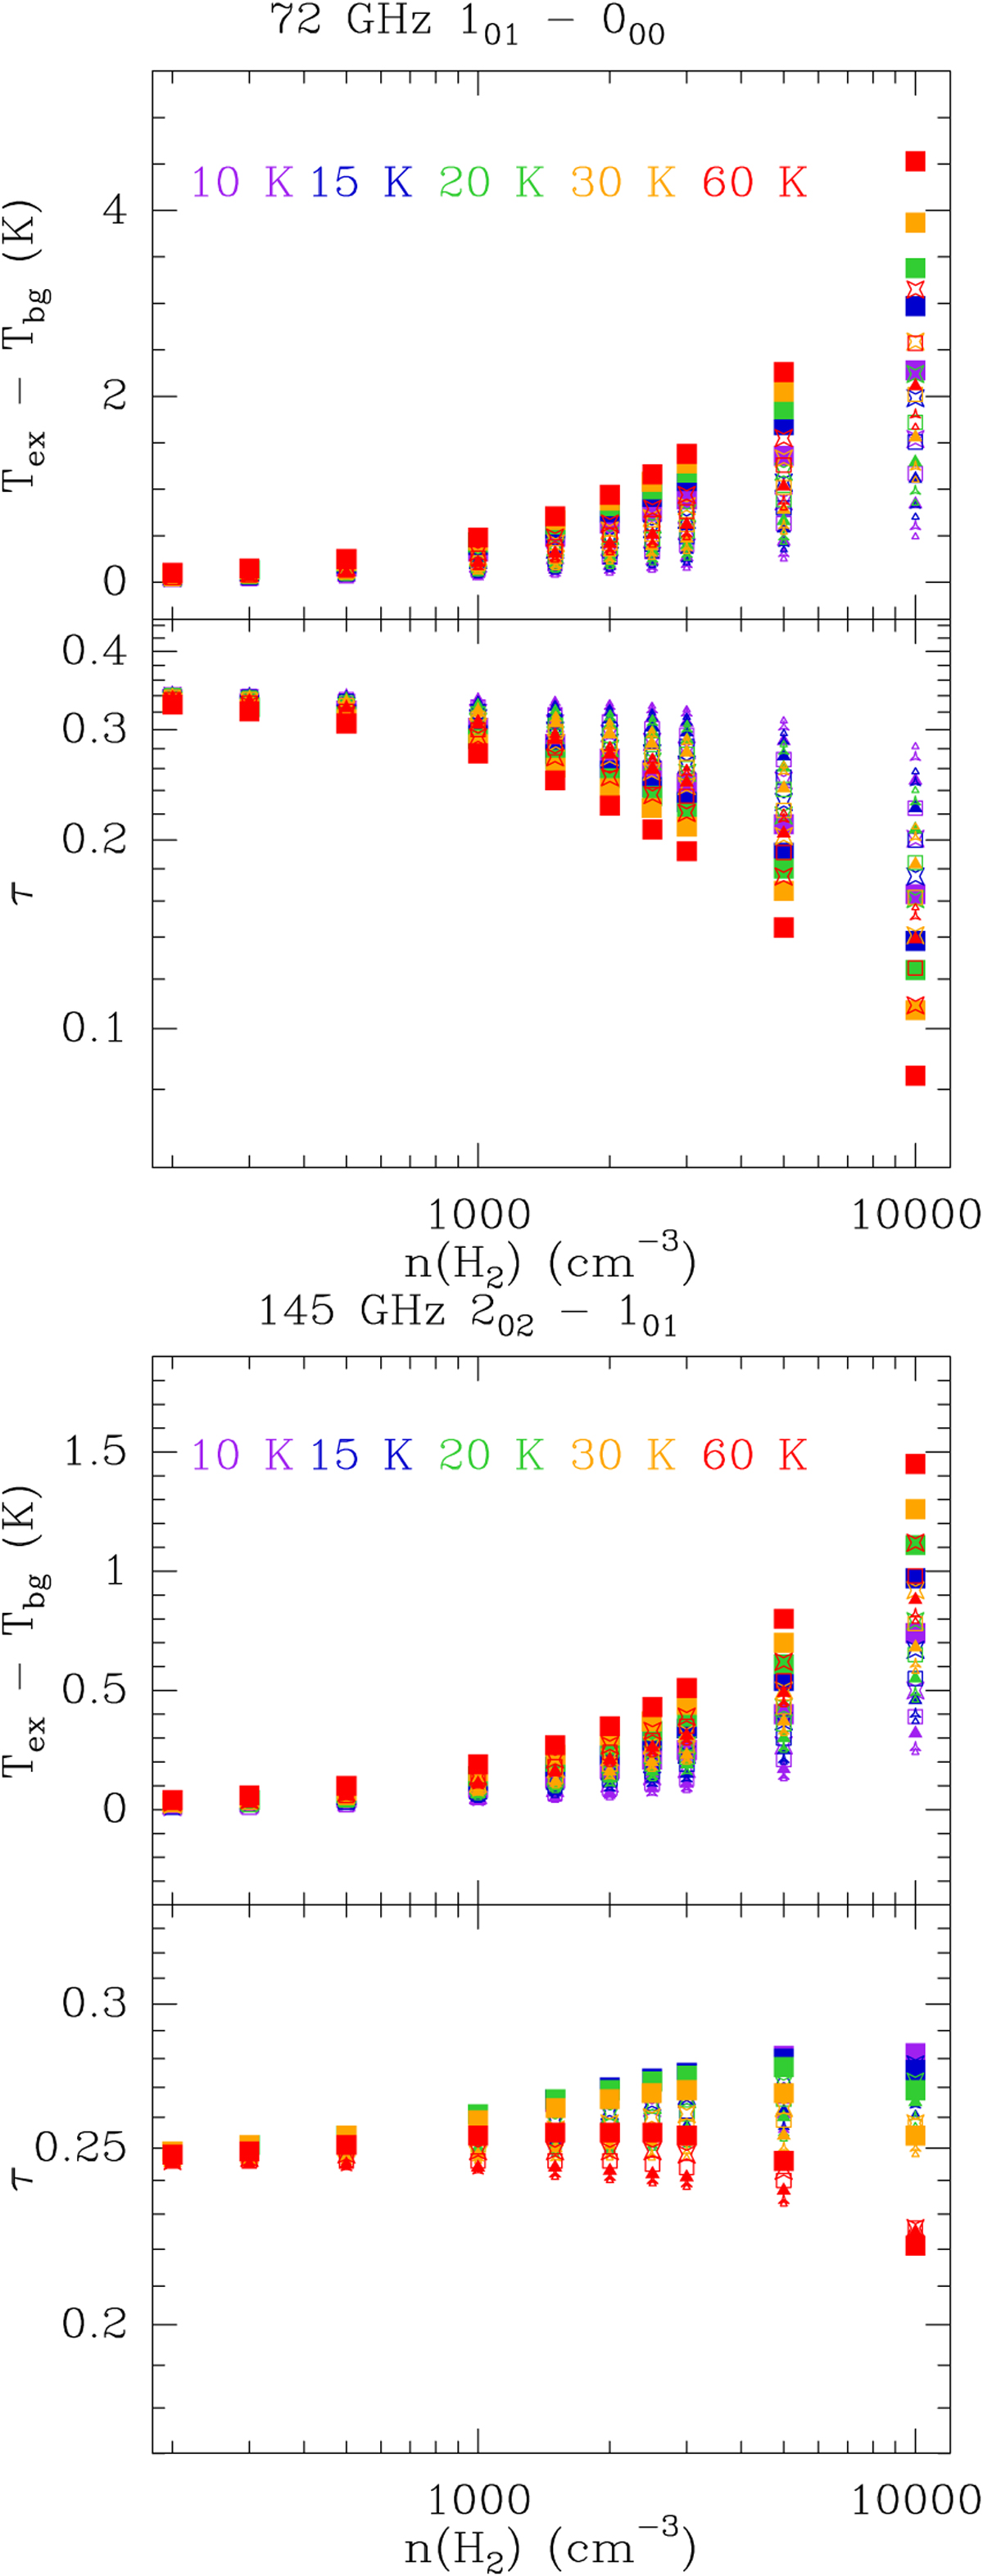
Fig. A.1
Download original image
Variation of the predicted excitation temperature (top) and opacity (bottom) for the two lowest lines of p-H2CO. The top panel shows the 10,1 − 00,0 line at 72 GHz, and the bottom panel shows the 20,2 − 10,1 line at 145 GHz. The p-H2CO column density is set to 7.3 × 1011 cm-2, the line FWHM is 0.5 km s-1. The kinetic temperature varies from 10 K to 60 K. The H2 ortho-to-para ratio varies with the kinetic temperature. The symbol sizes and shapes indicate the electron fraction : empty triangles for 2 × 10⁻⁶, starred triangles for 10-5, filled triangles for 3 × 10⁻⁵, empty squares for 6 × 10⁻⁵, starred squares for 10-4, and filled squares for 2 × 10⁻⁴. Larger symbols are used for larger values of the electron fraction. The 10,1 − 00,0 line at 72 GHz has not been observed in this work.
Current usage metrics show cumulative count of Article Views (full-text article views including HTML views, PDF and ePub downloads, according to the available data) and Abstracts Views on Vision4Press platform.
Data correspond to usage on the plateform after 2015. The current usage metrics is available 48-96 hours after online publication and is updated daily on week days.
Initial download of the metrics may take a while.