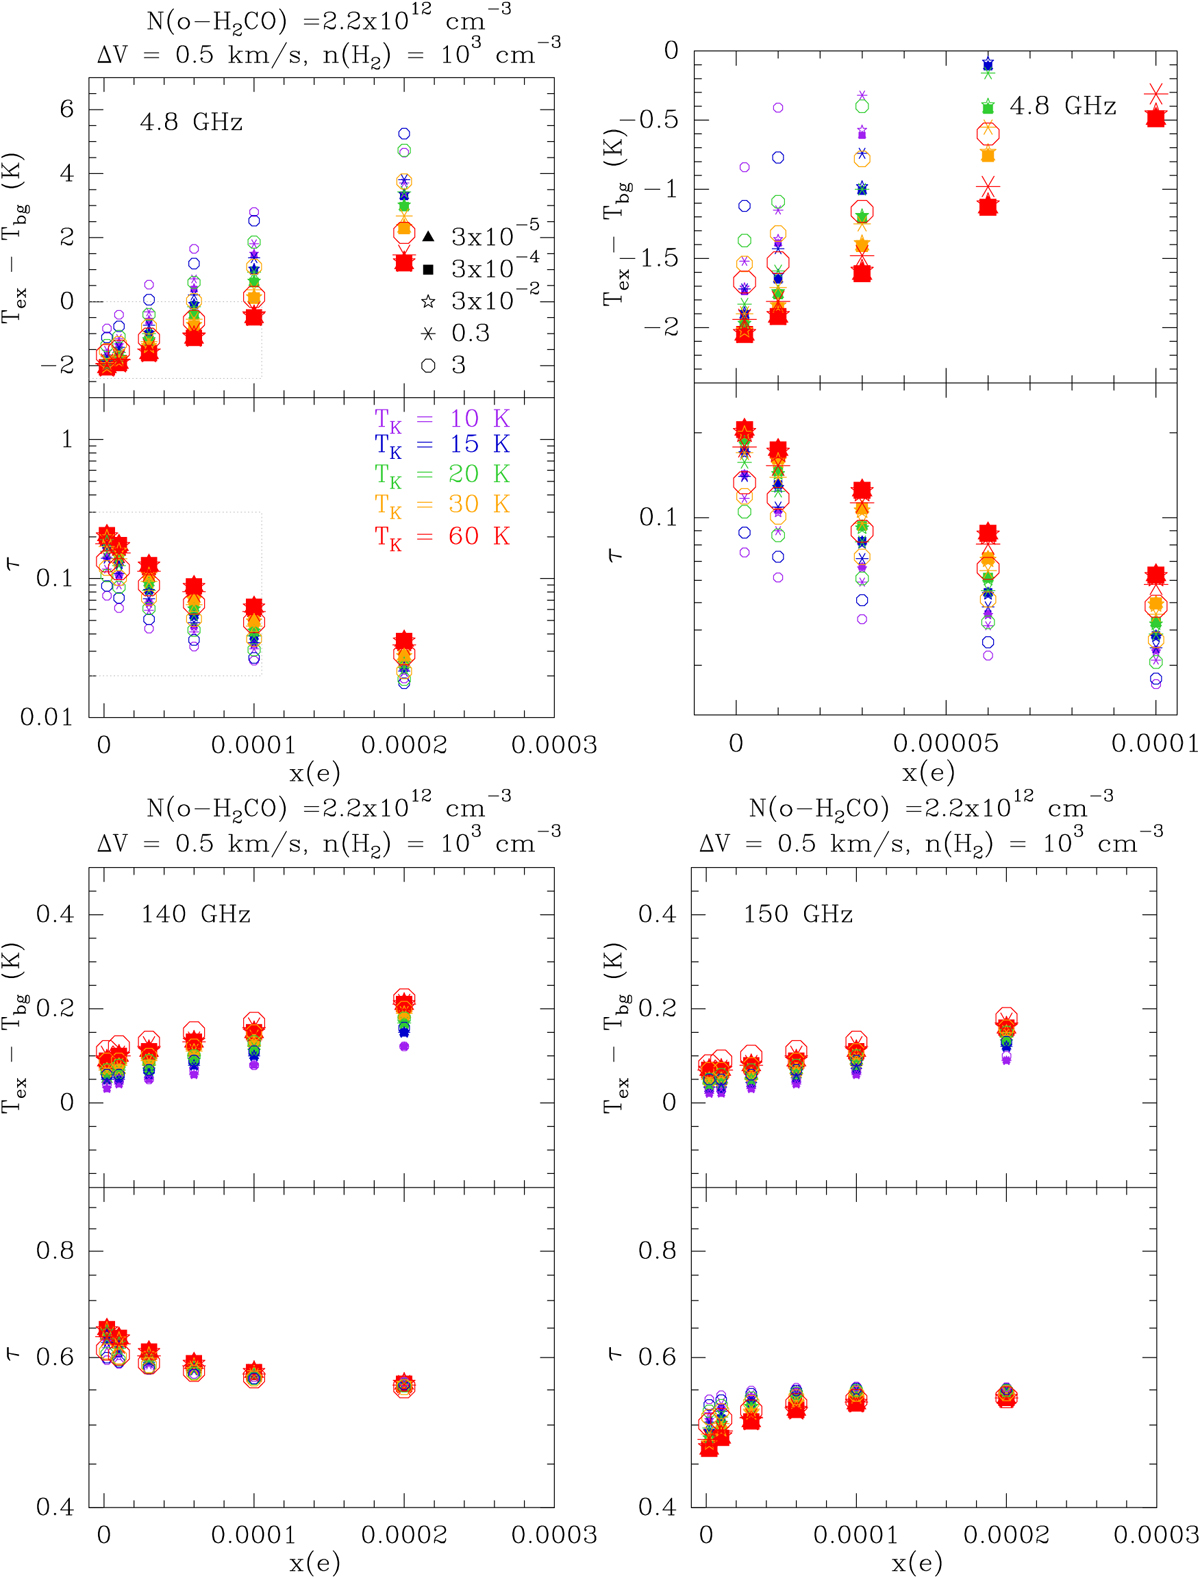
Fig. 3
Download original image
Variation of the excitation temperature and opacity with the electron fraction, kinetic temperature, and H2 ortho-to-para ratio for the 11,0−11,1 line at 4.8 GHz (top left), and zoom on the region with excitation temperature lower than the CMB indicated by a dotted box (top right). The 21,2−11,1 line at 140 GHz is shown in the bottom left panel and the 21,1−11,0 line at 150 GHz in the bottom right panel. The difference between the excitation temperature and the CMB is plotted to illustrate the change of regime of the 11,0−11,1 transition at 4.8 GHz, and a different scale is used for the 140 GHz and 150 GHz lines. Different symbols show the values of the H2 ortho-to-para ratio between 3 × 10⁻⁵ and 3, their color and size indicate the kinetic temperature between 10 and 60 K. The column density of o-H2CO is 2.2 × 1012 cm-2, the H2 density is set to 103 cm-3, and the FWHM is 0.5 km s-1. The 21,2−11,1 line at 140 GHz has not been observed in this work.
Current usage metrics show cumulative count of Article Views (full-text article views including HTML views, PDF and ePub downloads, according to the available data) and Abstracts Views on Vision4Press platform.
Data correspond to usage on the plateform after 2015. The current usage metrics is available 48-96 hours after online publication and is updated daily on week days.
Initial download of the metrics may take a while.