Fig. 2
Download original image
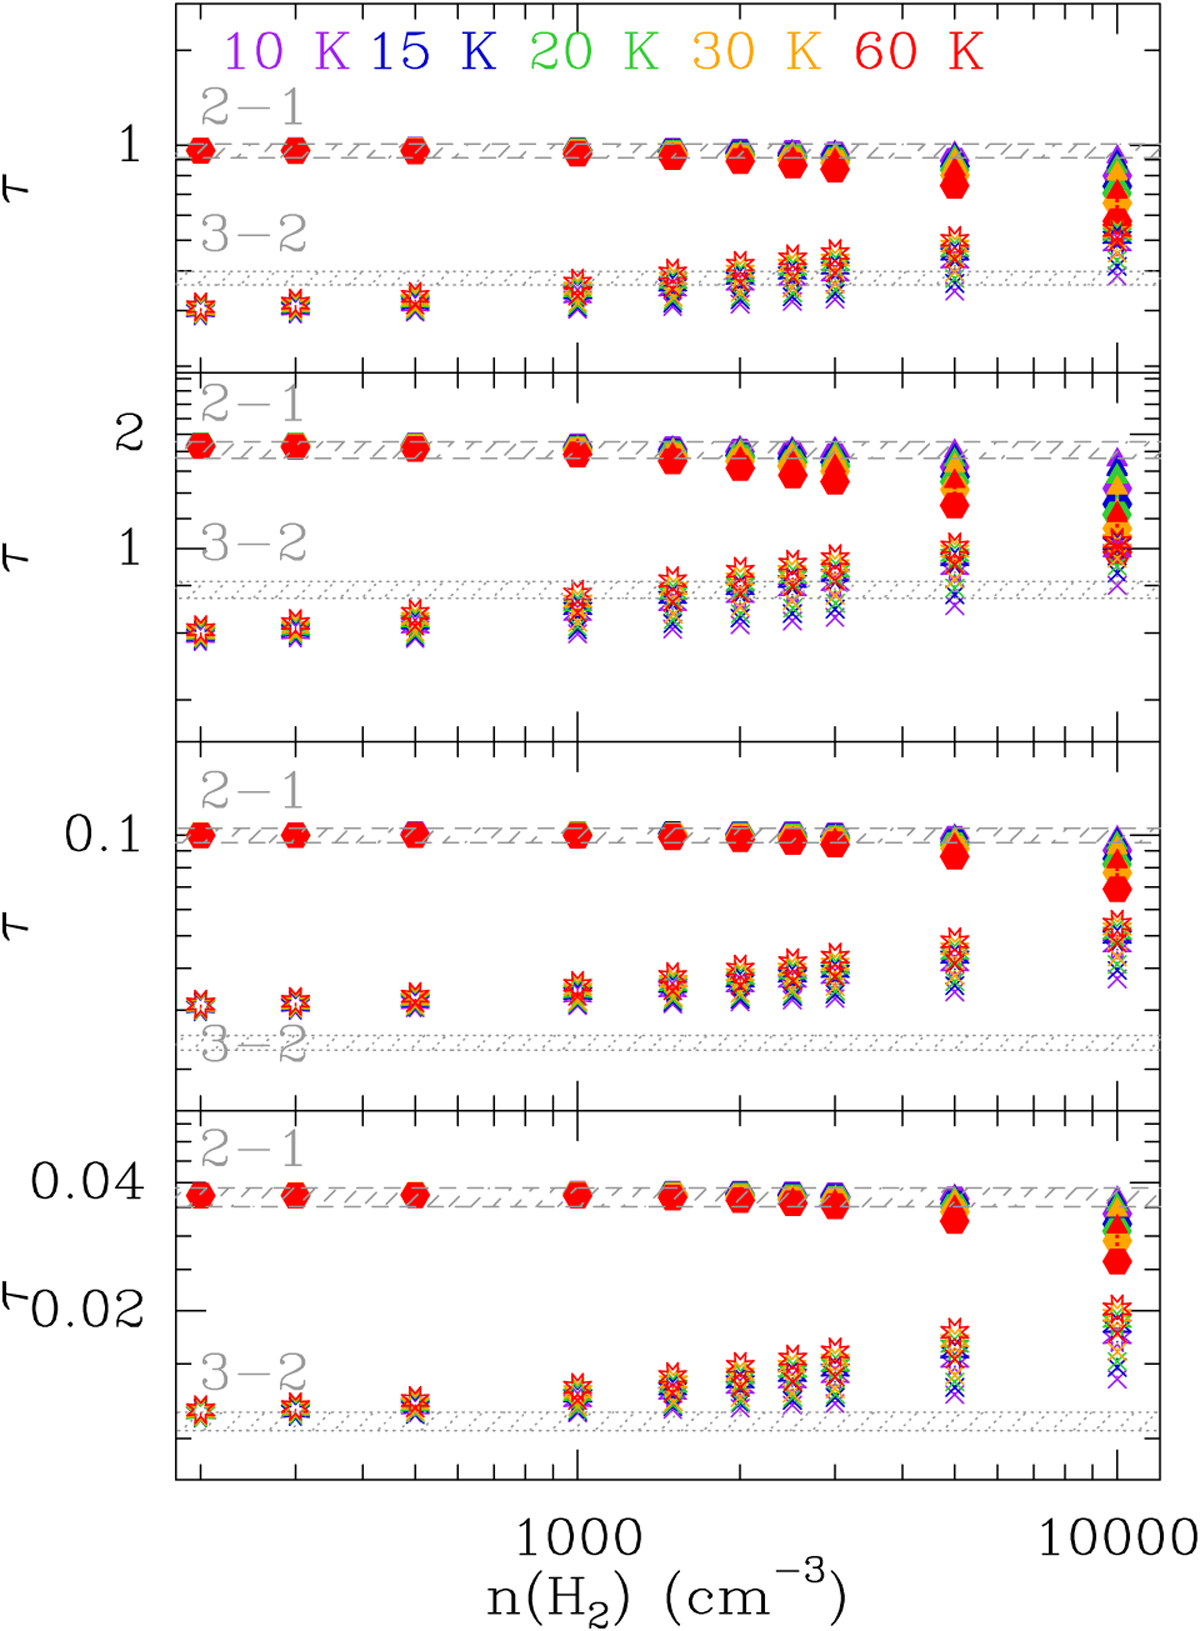
Variation of the predicted opacities of the CS (2–1) (filled symbols) and CS (3–2) (starred symbols) transitions as a function of the molecular hydrogen density in the diffuse and translucent cloud conditions computed with RADEX using the column densities and FWHM listed in Table 3. The colors show the kinetic temperature from 10 to 60 K, and the H2 ortho-to-para ratio scales with the kinetic temperature. The symbol shapes indicate the electron fraction as follows for the CS (2–1) line: lower than 2 × 10⁻⁵ filled triangles, between 2 × 10⁻⁵ and 10-4, small filled squares, and filled circles for 2 × 10⁻⁴. A similar progression is used for the CS (3–2) line, lower than 2 × 10⁻⁵ crosses, between 2 × 10⁻⁵ and 10-4, small stars, and 8-branch stars for 2 × 10⁻⁴. The measured opacities for the four detected velocity components are shown with the dashed and dotted gray areas, from top to bottom: −17.2 km s-1, −10.3 km s-1, −8.5 km s-1 and −4 km s-1.
Current usage metrics show cumulative count of Article Views (full-text article views including HTML views, PDF and ePub downloads, according to the available data) and Abstracts Views on Vision4Press platform.
Data correspond to usage on the plateform after 2015. The current usage metrics is available 48-96 hours after online publication and is updated daily on week days.
Initial download of the metrics may take a while.