Fig. 1
Download original image
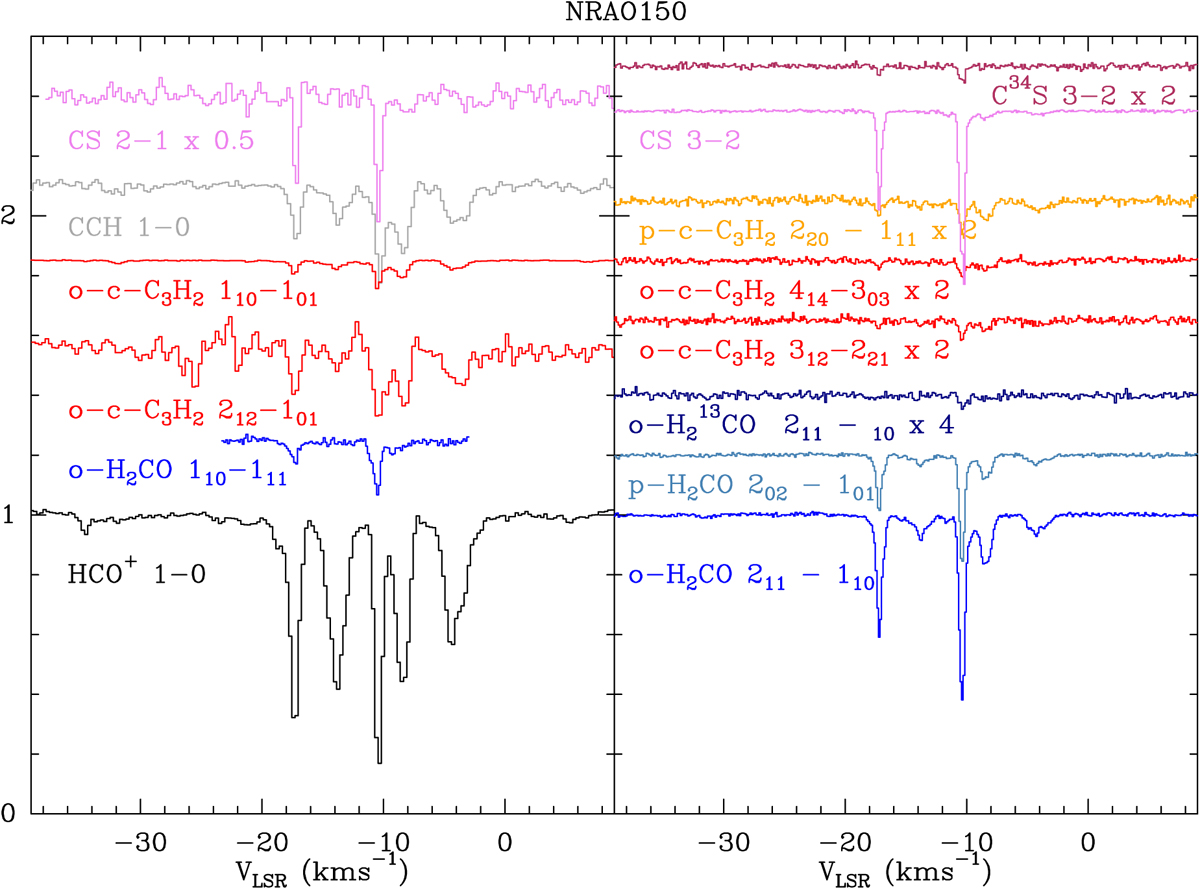
Absorption lines detected toward NRAO 150. The left panel shows previous detections including the o-H2CO (11,0–11,1) line at 4.8 GHz and the o-c-C3H2 (11,0–10,1) line at 18 GHz observed at the VLA (Liszt & Lucas 1995; Liszt et al. 2012), and the CS (2–1) (98 GHz), o-c-C3H2 (21,2–10,1)(85.3 GHz), CCH(1, 3/2, 2–0,1/2,1) (87.3 GHz), and HCO+(1–0) (89.2 GHz) lines (Liszt & Lucas 1995; Lucas & Liszt 1994, 1996, 2000, 2002) observed with the PdBI. The right panel presents the new observations including the o-H2CO(21,1–10,2), o-H213CO(21,1–10,2), and p-H2CO (20,2–10,1) lines, the CS (3–2), C34S(3–2) lines, and the c-C3H2 transitions listed in Table 2. All displayed spectra have been normalized by the continuum strength. Vertical offsets have been used for clarity.
Current usage metrics show cumulative count of Article Views (full-text article views including HTML views, PDF and ePub downloads, according to the available data) and Abstracts Views on Vision4Press platform.
Data correspond to usage on the plateform after 2015. The current usage metrics is available 48-96 hours after online publication and is updated daily on week days.
Initial download of the metrics may take a while.