Open Access
Fig. 15.
Download original image
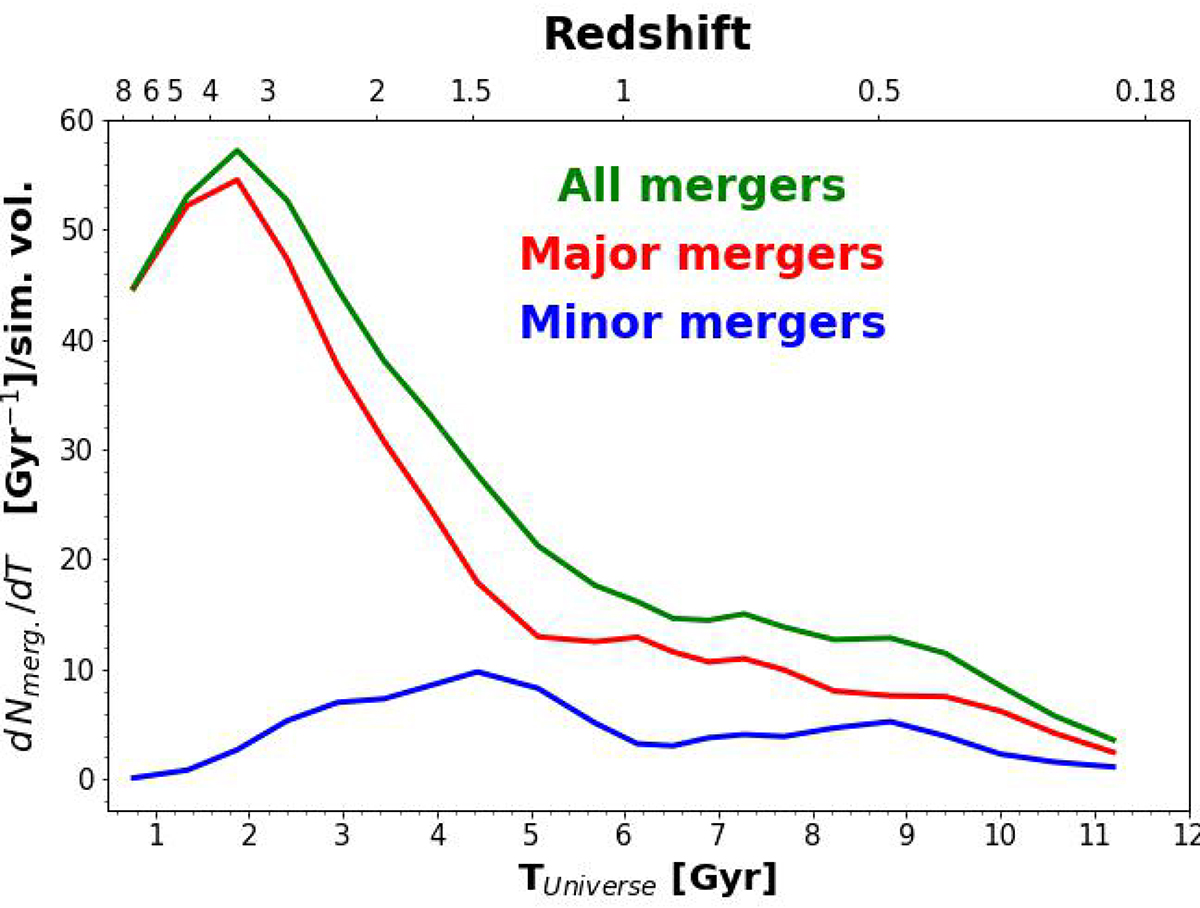
Evolution of the merger rates of primary black holes with a mass greater than 2 × 10⁴ M⊙ in the simulated volume (green line). The red and blue lines correspond respectively to major and minor mergers delimited by a 1:4 mass ratio. We have slightly smoothed the curves to emphasis the general trends.
Current usage metrics show cumulative count of Article Views (full-text article views including HTML views, PDF and ePub downloads, according to the available data) and Abstracts Views on Vision4Press platform.
Data correspond to usage on the plateform after 2015. The current usage metrics is available 48-96 hours after online publication and is updated daily on week days.
Initial download of the metrics may take a while.