Fig. 13.
Download original image
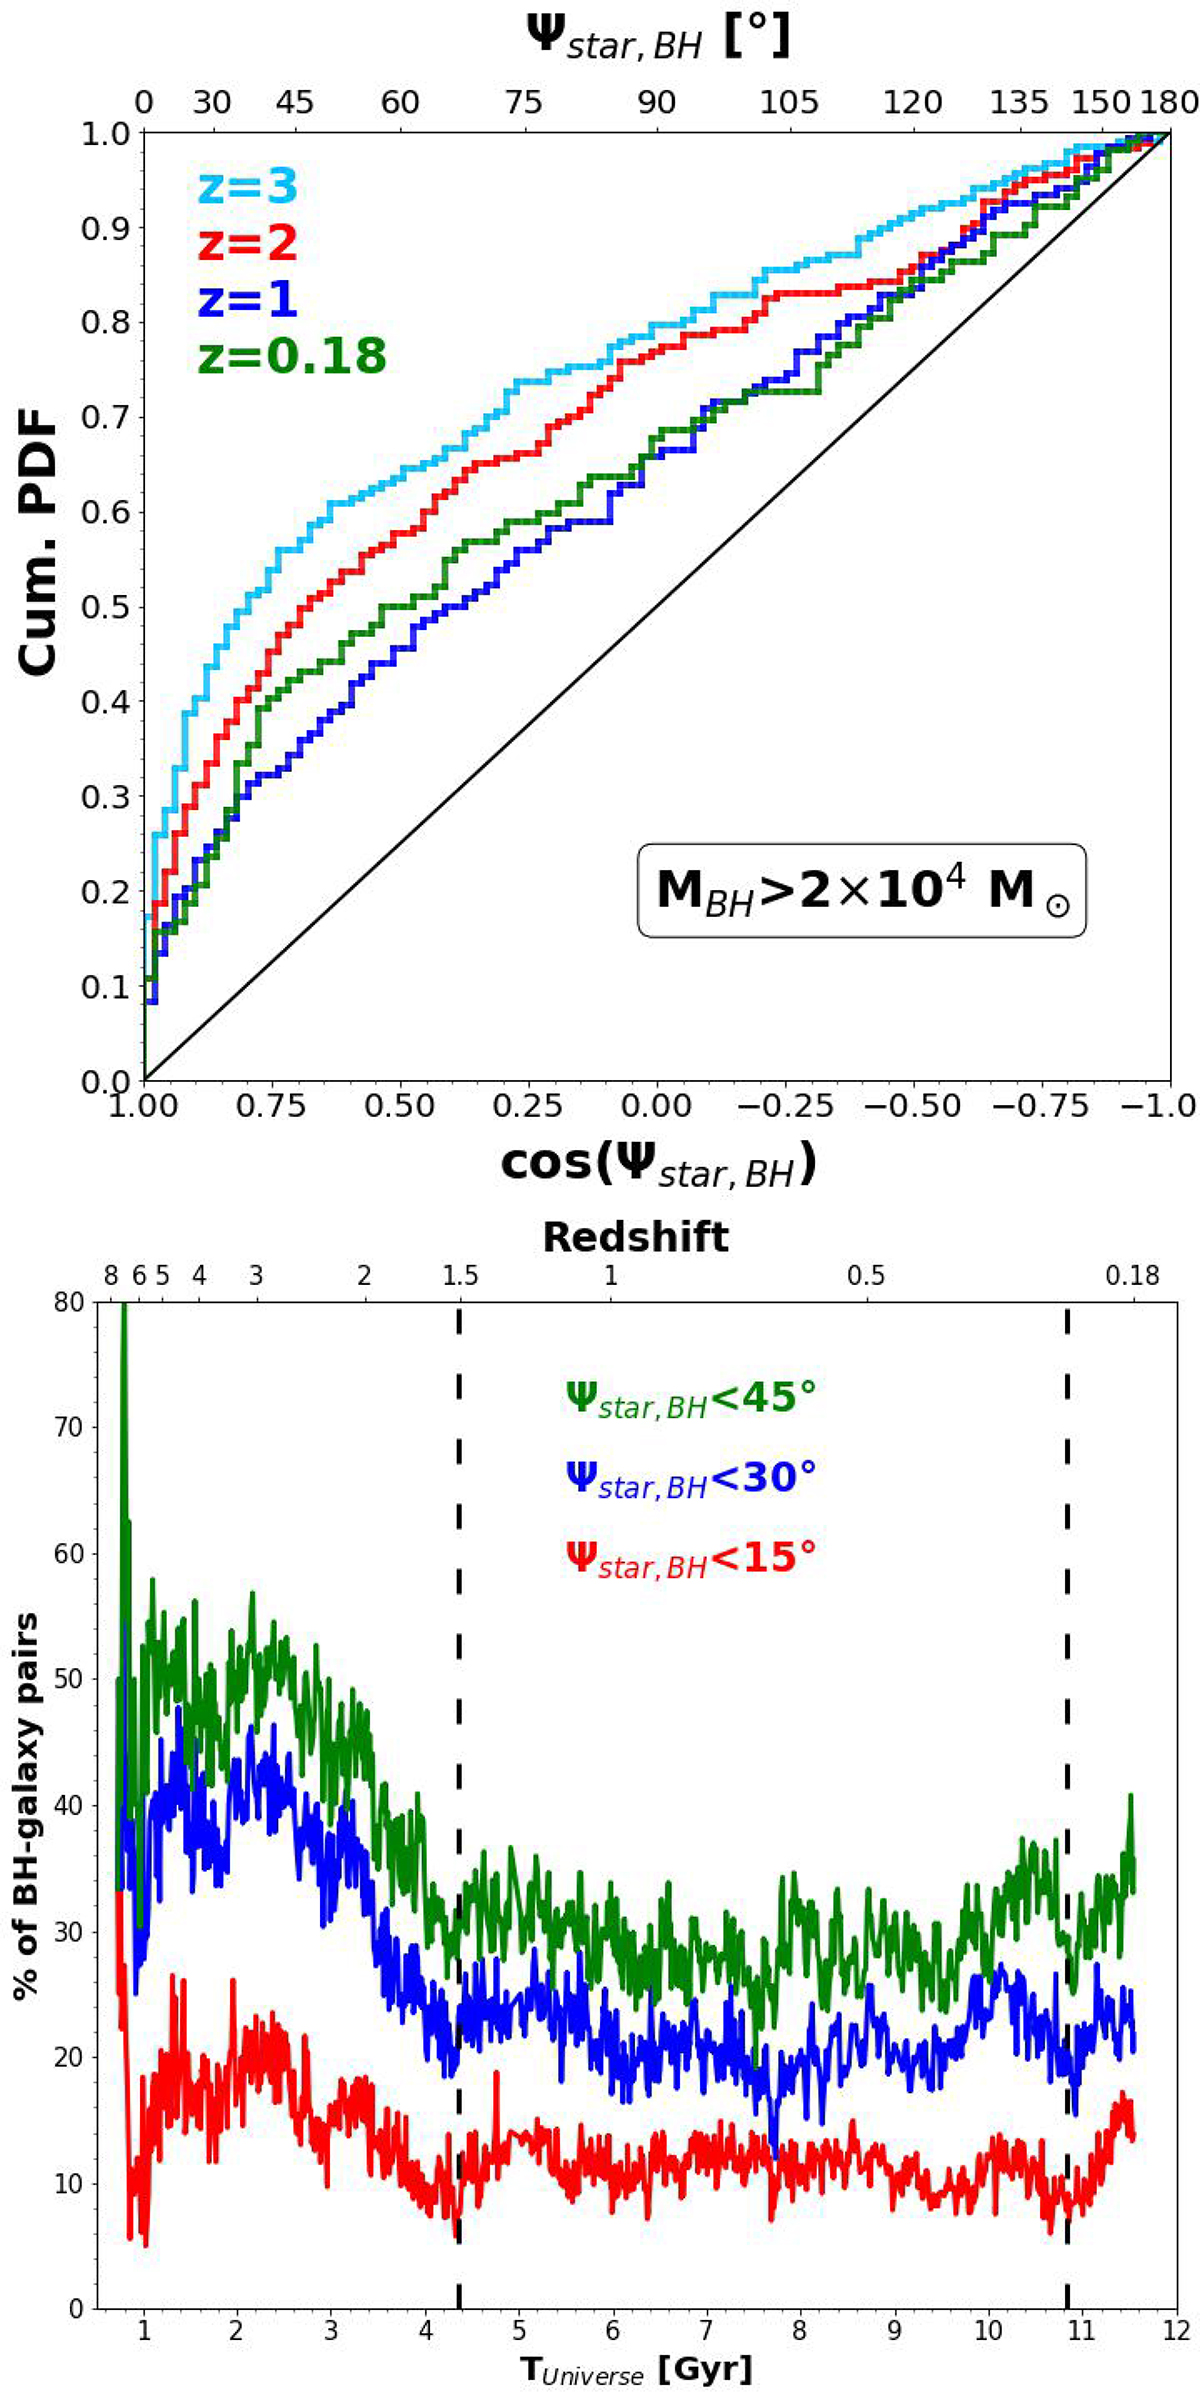
Cumulative distributions of cos(Ψstar, BH) at different redshifts (upper panel). The black line represents the cumulative distribution of a uniform distribution. In the lower panel, we show additionally show the evolution of the percentage of BHs or BH-galaxy systems that present an alignment angle Ψstar, BH lower than 45° (red line), 30° (blue line), or 15° (red line). The two vertical dashed lines indicate the epochs where an additional level of refinement was added in the simulation.
Current usage metrics show cumulative count of Article Views (full-text article views including HTML views, PDF and ePub downloads, according to the available data) and Abstracts Views on Vision4Press platform.
Data correspond to usage on the plateform after 2015. The current usage metrics is available 48-96 hours after online publication and is updated daily on week days.
Initial download of the metrics may take a while.