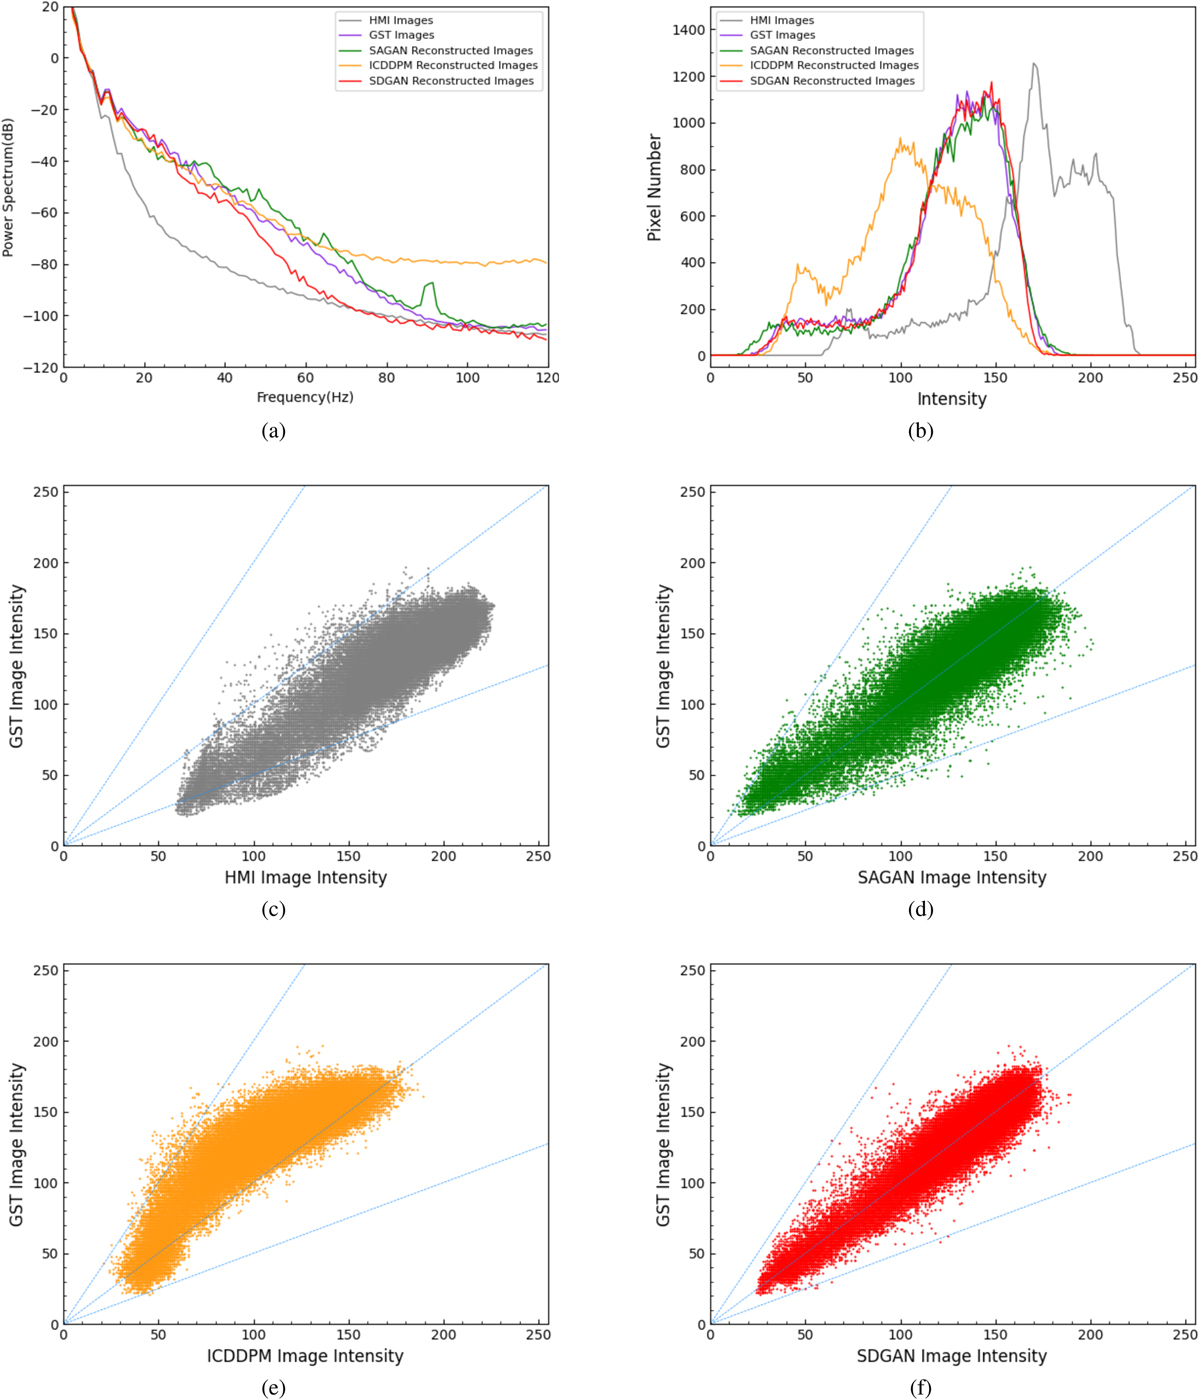
Fig. 9
Download original image
Display of azimuthally average power spectrum plot (panel a), grayscale histogram (panel b) and scatter plots of reconstructed images (panels c, d, e, f). The azimuthally averaged power spectrum plot shows the frequency information of the image, and the grayscale histogram illustrates the density of the pixel distribution. Scatter plots depict the relationship between images.
Current usage metrics show cumulative count of Article Views (full-text article views including HTML views, PDF and ePub downloads, according to the available data) and Abstracts Views on Vision4Press platform.
Data correspond to usage on the plateform after 2015. The current usage metrics is available 48-96 hours after online publication and is updated daily on week days.
Initial download of the metrics may take a while.