Fig. 8
Download original image
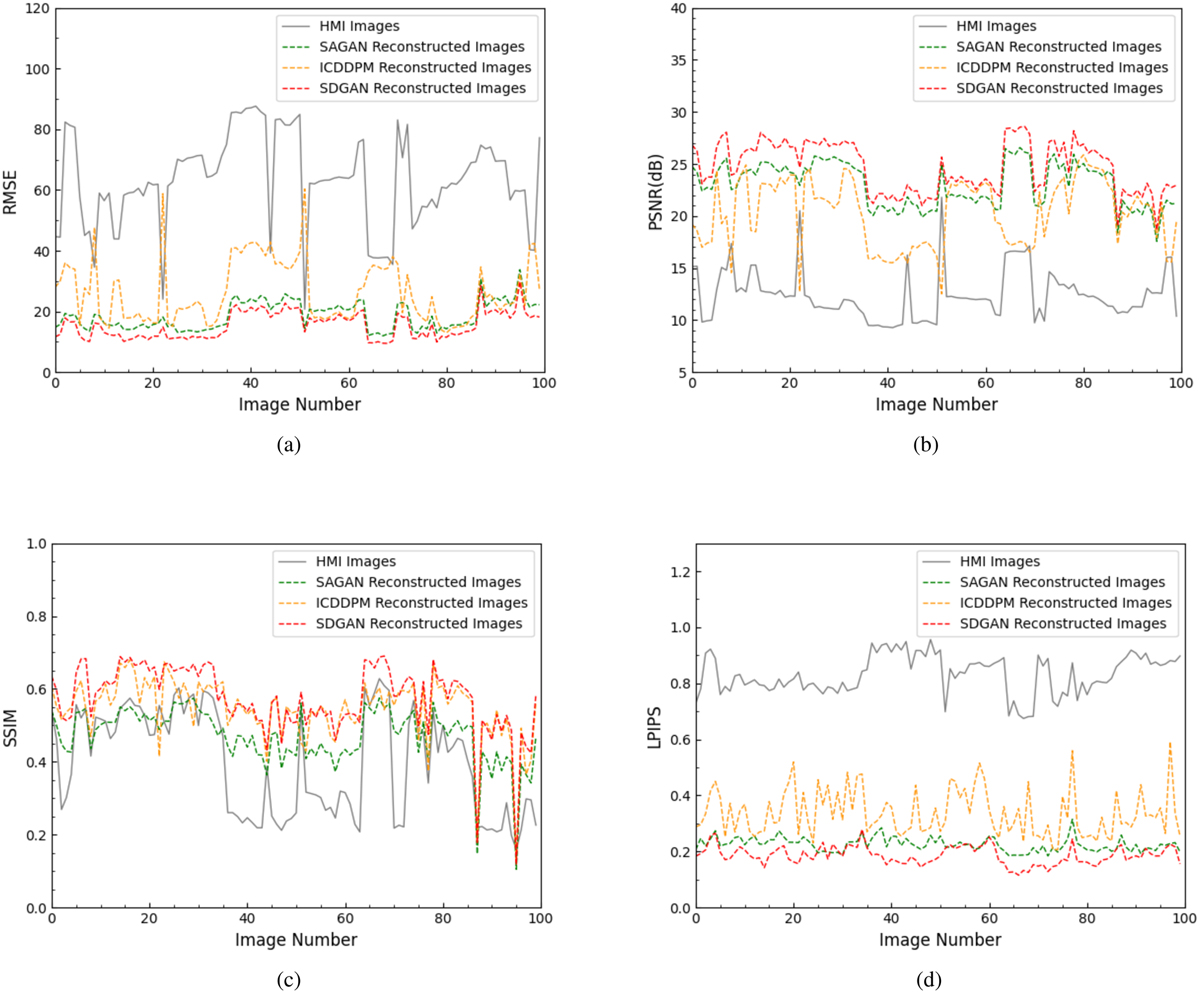
RMSE, peak S/N, SSIM, and LPIPS metrics for SR reconstruction results of images from the test set. The gray, green, orange, and red lines in (a), (b), (c), and (d) represent the metrics calculated by GST images with the corresponding HMI images, images reconstructed by SAGAN, images reconstructed by ICDDPM, and images reconstructed by SDGAN, respectively.
Current usage metrics show cumulative count of Article Views (full-text article views including HTML views, PDF and ePub downloads, according to the available data) and Abstracts Views on Vision4Press platform.
Data correspond to usage on the plateform after 2015. The current usage metrics is available 48-96 hours after online publication and is updated daily on week days.
Initial download of the metrics may take a while.