Fig. 7
Download original image
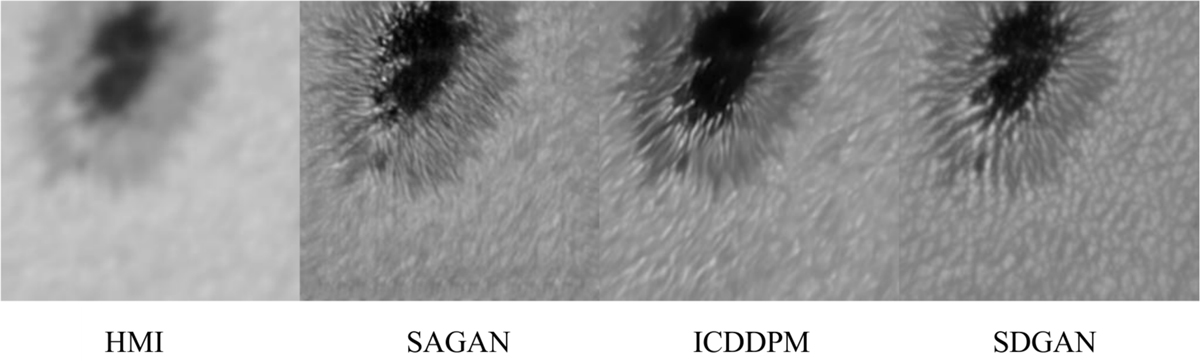
One frame from the animation of SR reconstruction results of HMI images from September 1 to 9, 2017. From left to right, we show the HMI image and reconstructed images of SAGAN, ICDDPM, and SDGAN. The animation is 15 frames s−1 and runs for 34 s; its reconstructed image shows a better representation of the typical dynamics of a sunspot (an animated version of this figure is available online).
Current usage metrics show cumulative count of Article Views (full-text article views including HTML views, PDF and ePub downloads, according to the available data) and Abstracts Views on Vision4Press platform.
Data correspond to usage on the plateform after 2015. The current usage metrics is available 48-96 hours after online publication and is updated daily on week days.
Initial download of the metrics may take a while.