Fig. 6
Download original image
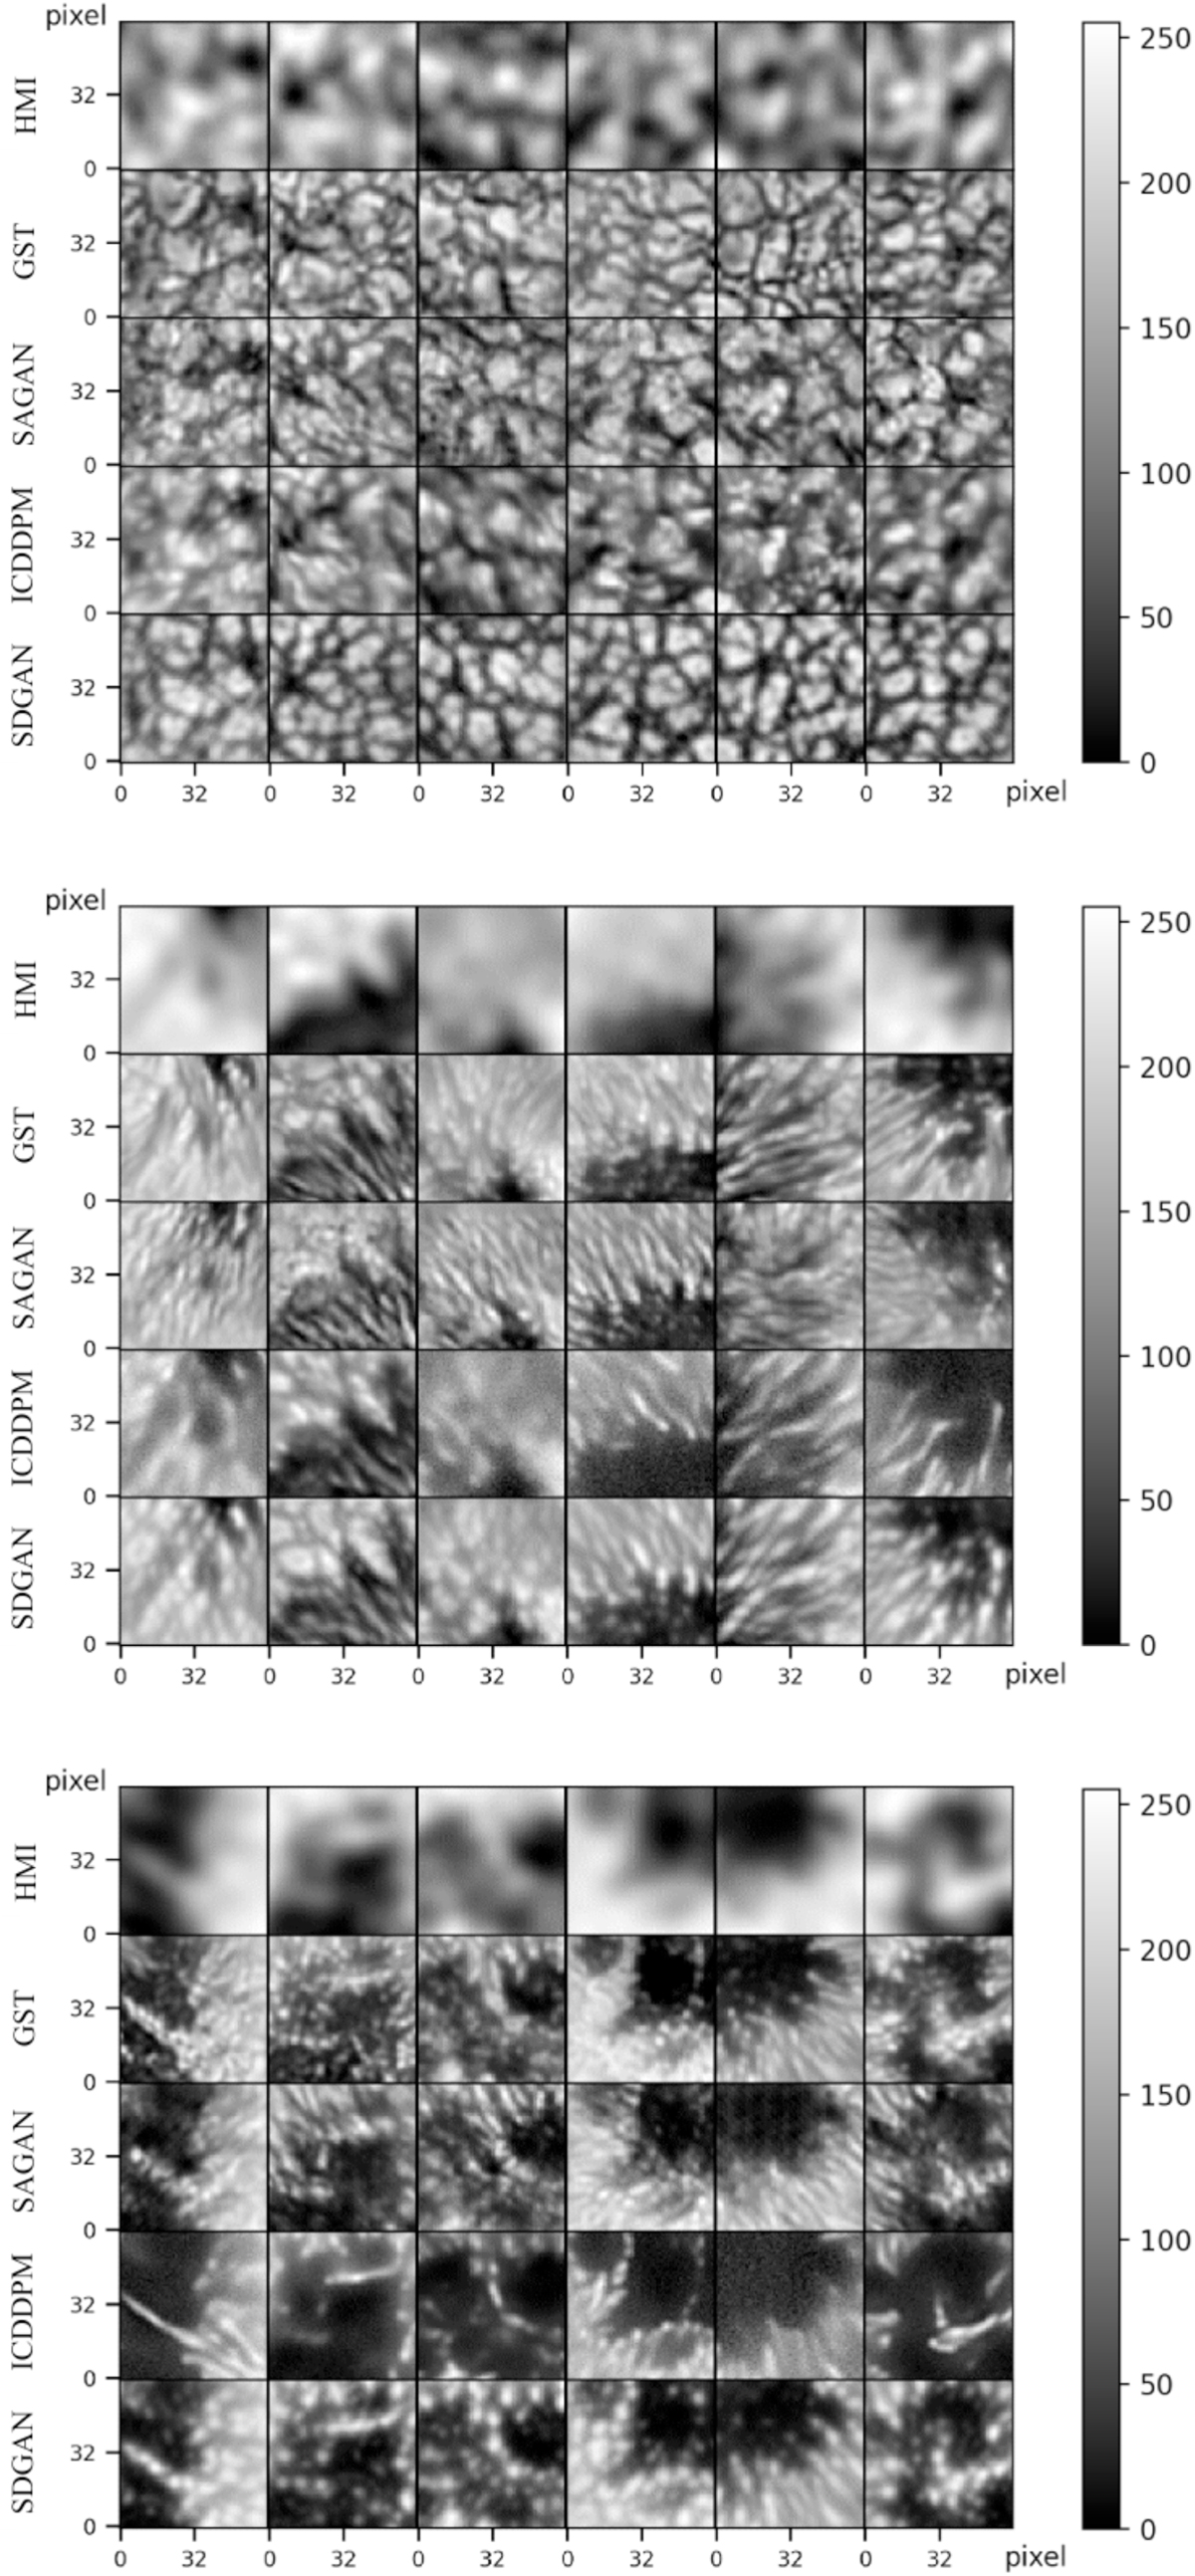
Presentation of reconstruction results for small-scale structures. Top: reconstruction results of solar penumbral filaments. Middle: reconstruction results of solar umbra. Bottom: reconstruction results of solar granules. The HMI in the figure has undergone 4× upsampling. The first row in each image is the HMI image, the second row is the GST image, and the third to fifth rows are the reconstruction results of SAGAN, ICDDPM, and SDGAN for the small-scale structures of HMI images.
Current usage metrics show cumulative count of Article Views (full-text article views including HTML views, PDF and ePub downloads, according to the available data) and Abstracts Views on Vision4Press platform.
Data correspond to usage on the plateform after 2015. The current usage metrics is available 48-96 hours after online publication and is updated daily on week days.
Initial download of the metrics may take a while.