Open Access
Fig. A.2
Download original image
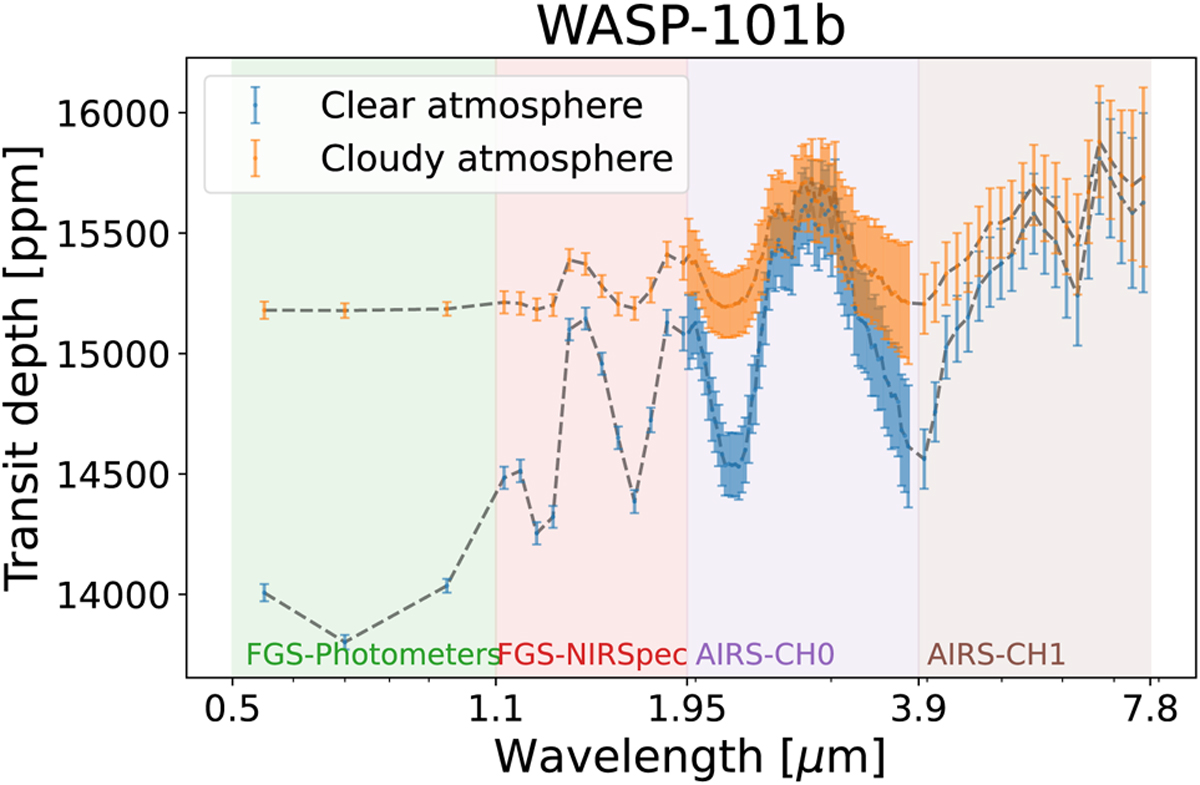
Simulated Ariel transmission spectra of WASP-101b’s atmosphere. In orange, we show a model with thick clouds consistent with previous HST data. In blue, we display a model with a clear atmosphere. The colors correspond to the different instruments and channels of Ariel.
Current usage metrics show cumulative count of Article Views (full-text article views including HTML views, PDF and ePub downloads, according to the available data) and Abstracts Views on Vision4Press platform.
Data correspond to usage on the plateform after 2015. The current usage metrics is available 48-96 hours after online publication and is updated daily on week days.
Initial download of the metrics may take a while.