Fig. 5.
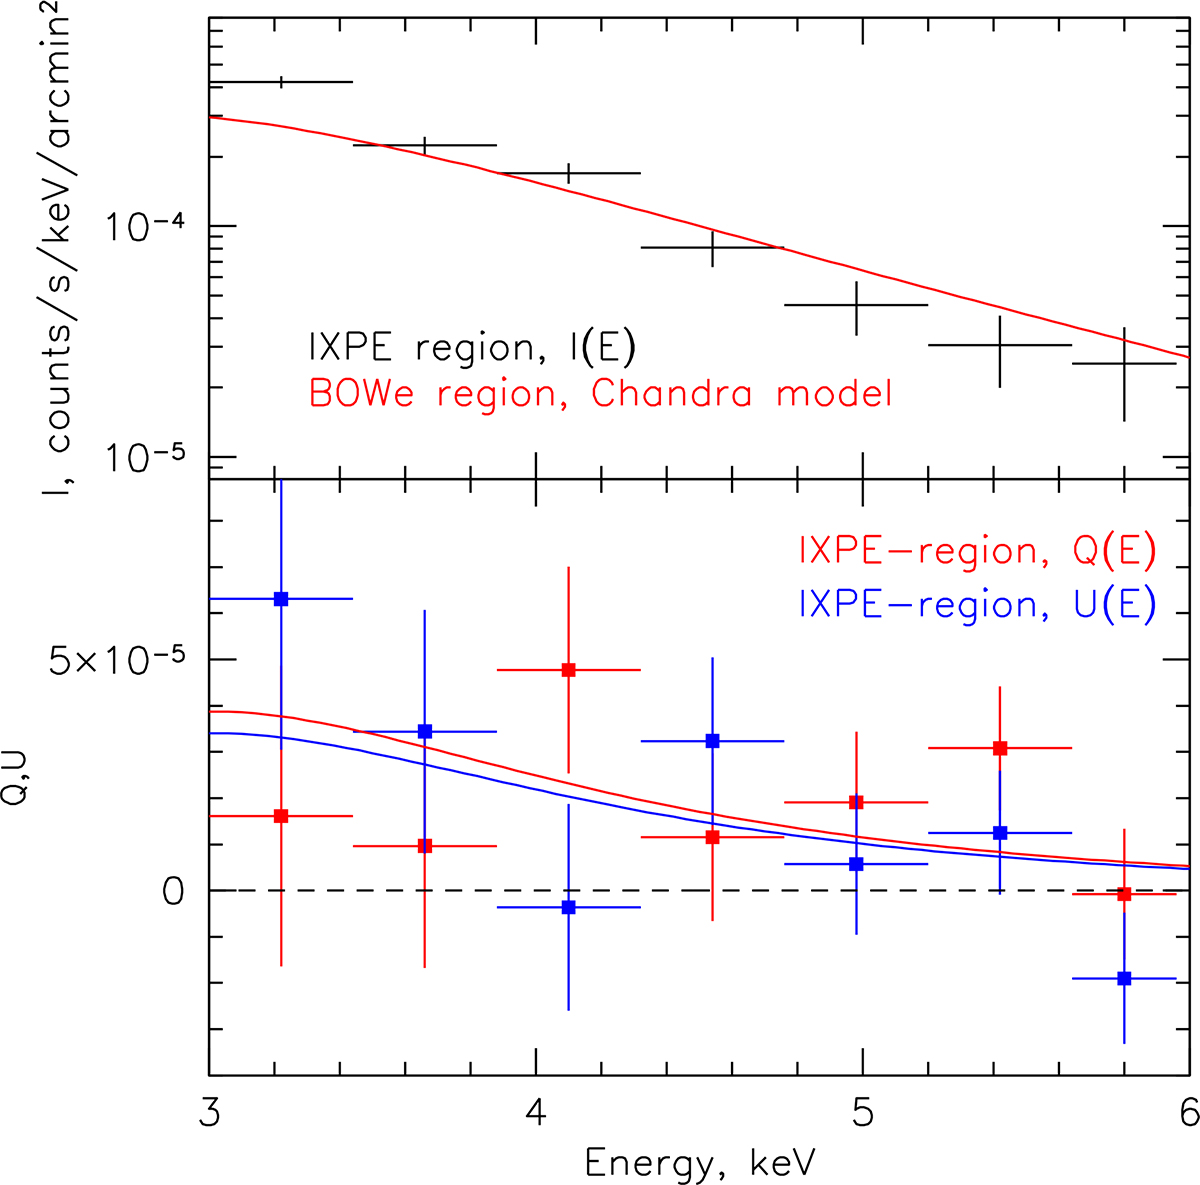
Download original image
IXPE spectra. Top panel: IXPE total background-subtracted Stokes I(E) spectrum in the 3−6 keV band from the IXPE region (see Figs. 2 and 3) is shown with the black points. The red line in the top panel shows Chandra’s Wings-e region model (see Fig. 4) convolved with the IXPE response. Bottom panel: Stokes Q(E) and U(E) spectra of the IXPE region: red and blue points, respectively. The solid lines show the expected spectra for Chandra’s Wings-e model and the best-fitting polarization degree PD = 57 ± 18% and angle PA = 21 ± 9°.
Current usage metrics show cumulative count of Article Views (full-text article views including HTML views, PDF and ePub downloads, according to the available data) and Abstracts Views on Vision4Press platform.
Data correspond to usage on the plateform after 2015. The current usage metrics is available 48-96 hours after online publication and is updated daily on week days.
Initial download of the metrics may take a while.