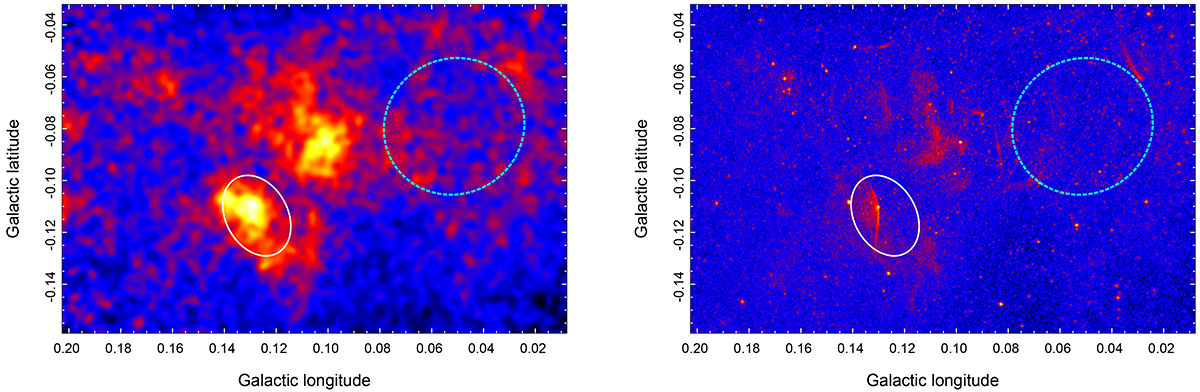
Fig. 2.
Download original image
3−6 keV IXPE (left panel) and Chandra (right panel) X-ray images. Two elliptical regions were used for spectra extraction. The white ellipse covers the G0.13−0.11 area. Given the uncertainties with the IXPE astrometry, a relatively large region was selected guided by the IXPE image. The bigger cyan region was used as a background region for spectral analysis. The Chandra image is in logarithmic scale to show more clearly bright point sources and faint diffuse emission. For the IXPE image, a linear scale is used.
Current usage metrics show cumulative count of Article Views (full-text article views including HTML views, PDF and ePub downloads, according to the available data) and Abstracts Views on Vision4Press platform.
Data correspond to usage on the plateform after 2015. The current usage metrics is available 48-96 hours after online publication and is updated daily on week days.
Initial download of the metrics may take a while.