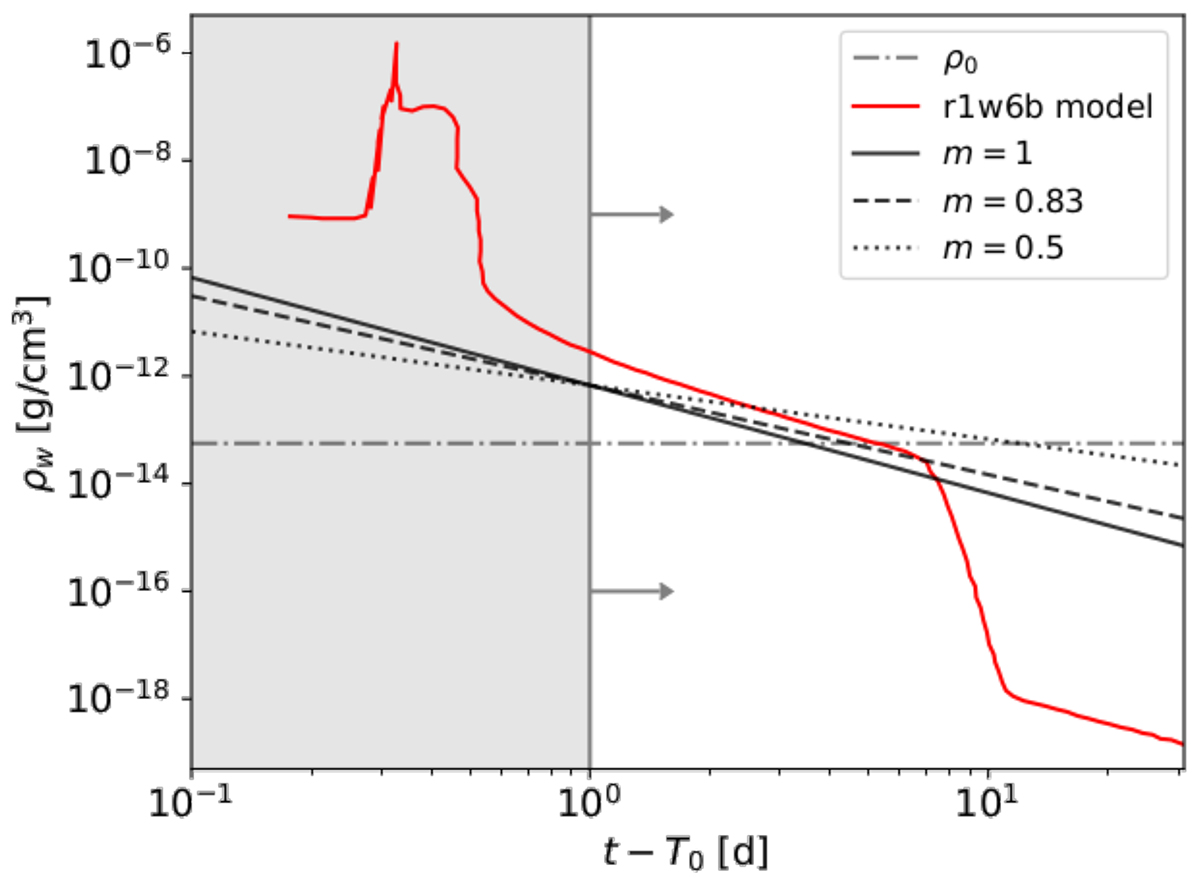
Fig. 6.
Download original image
Density profile encountered by the shock as a function of time for different expansion parameters m (including m = 0.83 as in Tatischeff 2009, a model applied to SN 1993J). We assumed ṀRSG = 10−2 M⊙ yr−1, uw = 100 km s−1, and Vs, 0 = 104 km s−1. The average density ρ0 obtained by Bostroem et al. (2023) is also displayed, as well as the best-fit density profile from the r1w6b model in Jacobson-Galán et al. (2023). The grey-shaded region excludes the times not considered in our discussion on the SN energy budget.
Current usage metrics show cumulative count of Article Views (full-text article views including HTML views, PDF and ePub downloads, according to the available data) and Abstracts Views on Vision4Press platform.
Data correspond to usage on the plateform after 2015. The current usage metrics is available 48-96 hours after online publication and is updated daily on week days.
Initial download of the metrics may take a while.