Open Access
Fig. 10.
Download original image
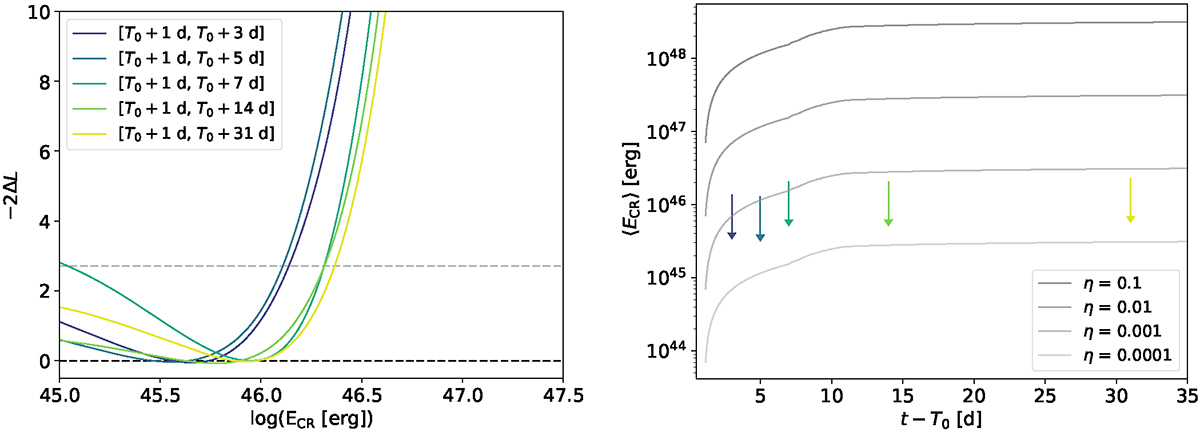
Limits using the best-fit density profile from Jacobson-Galán et al. (2023) shown in Fig. 6 (r1w6b model). Left: likelihood profile obtained by rescaling those displayed in Fig. 7, right panel. Right: limits on the cumulated total CR energy derived as in Fig. 8 but employing the aforementioned density profile.
Current usage metrics show cumulative count of Article Views (full-text article views including HTML views, PDF and ePub downloads, according to the available data) and Abstracts Views on Vision4Press platform.
Data correspond to usage on the plateform after 2015. The current usage metrics is available 48-96 hours after online publication and is updated daily on week days.
Initial download of the metrics may take a while.