Fig. 8.
Download original image
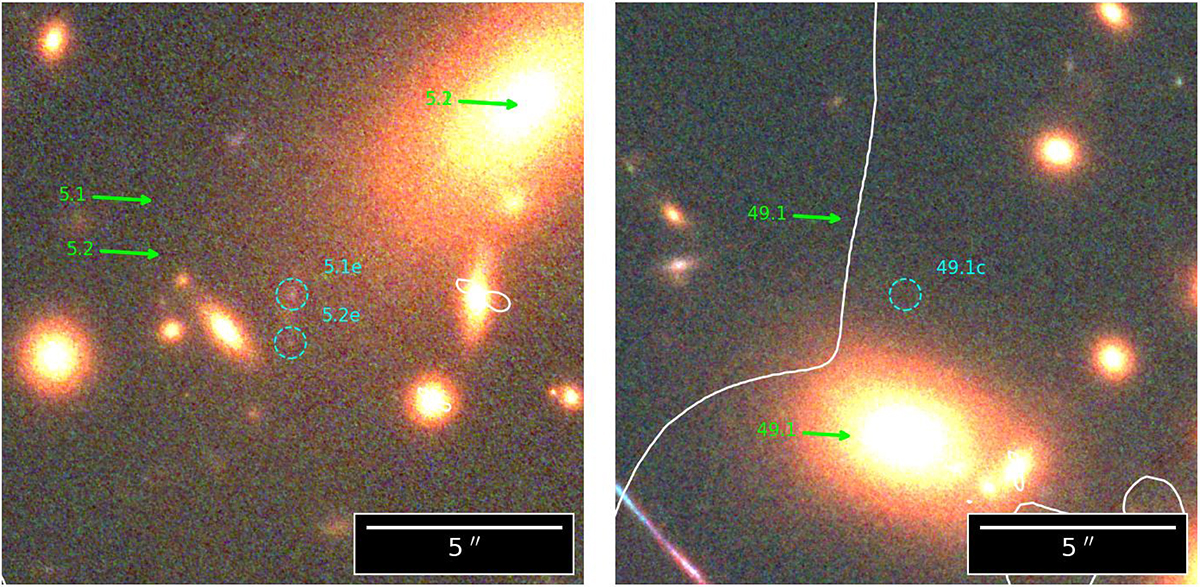
Predicted (green arrows) and observed (cyan dashed circles) positions for multiple lensed images 5.1e, 5.2e (left panel), and 49.1c (right panel). These multiple images were not detected originally and have been found by visually inspecting the data-cube around the positions predicted by the strong-lensing model. Note: System 49 is a Lyman-α emitter that is too faint to be visible in the RGB cutout, but it is clearly visible in the spectral data-cube (see the spectrum plots for system 49 in Fig. C.11).
Current usage metrics show cumulative count of Article Views (full-text article views including HTML views, PDF and ePub downloads, according to the available data) and Abstracts Views on Vision4Press platform.
Data correspond to usage on the plateform after 2015. The current usage metrics is available 48-96 hours after online publication and is updated daily on week days.
Initial download of the metrics may take a while.