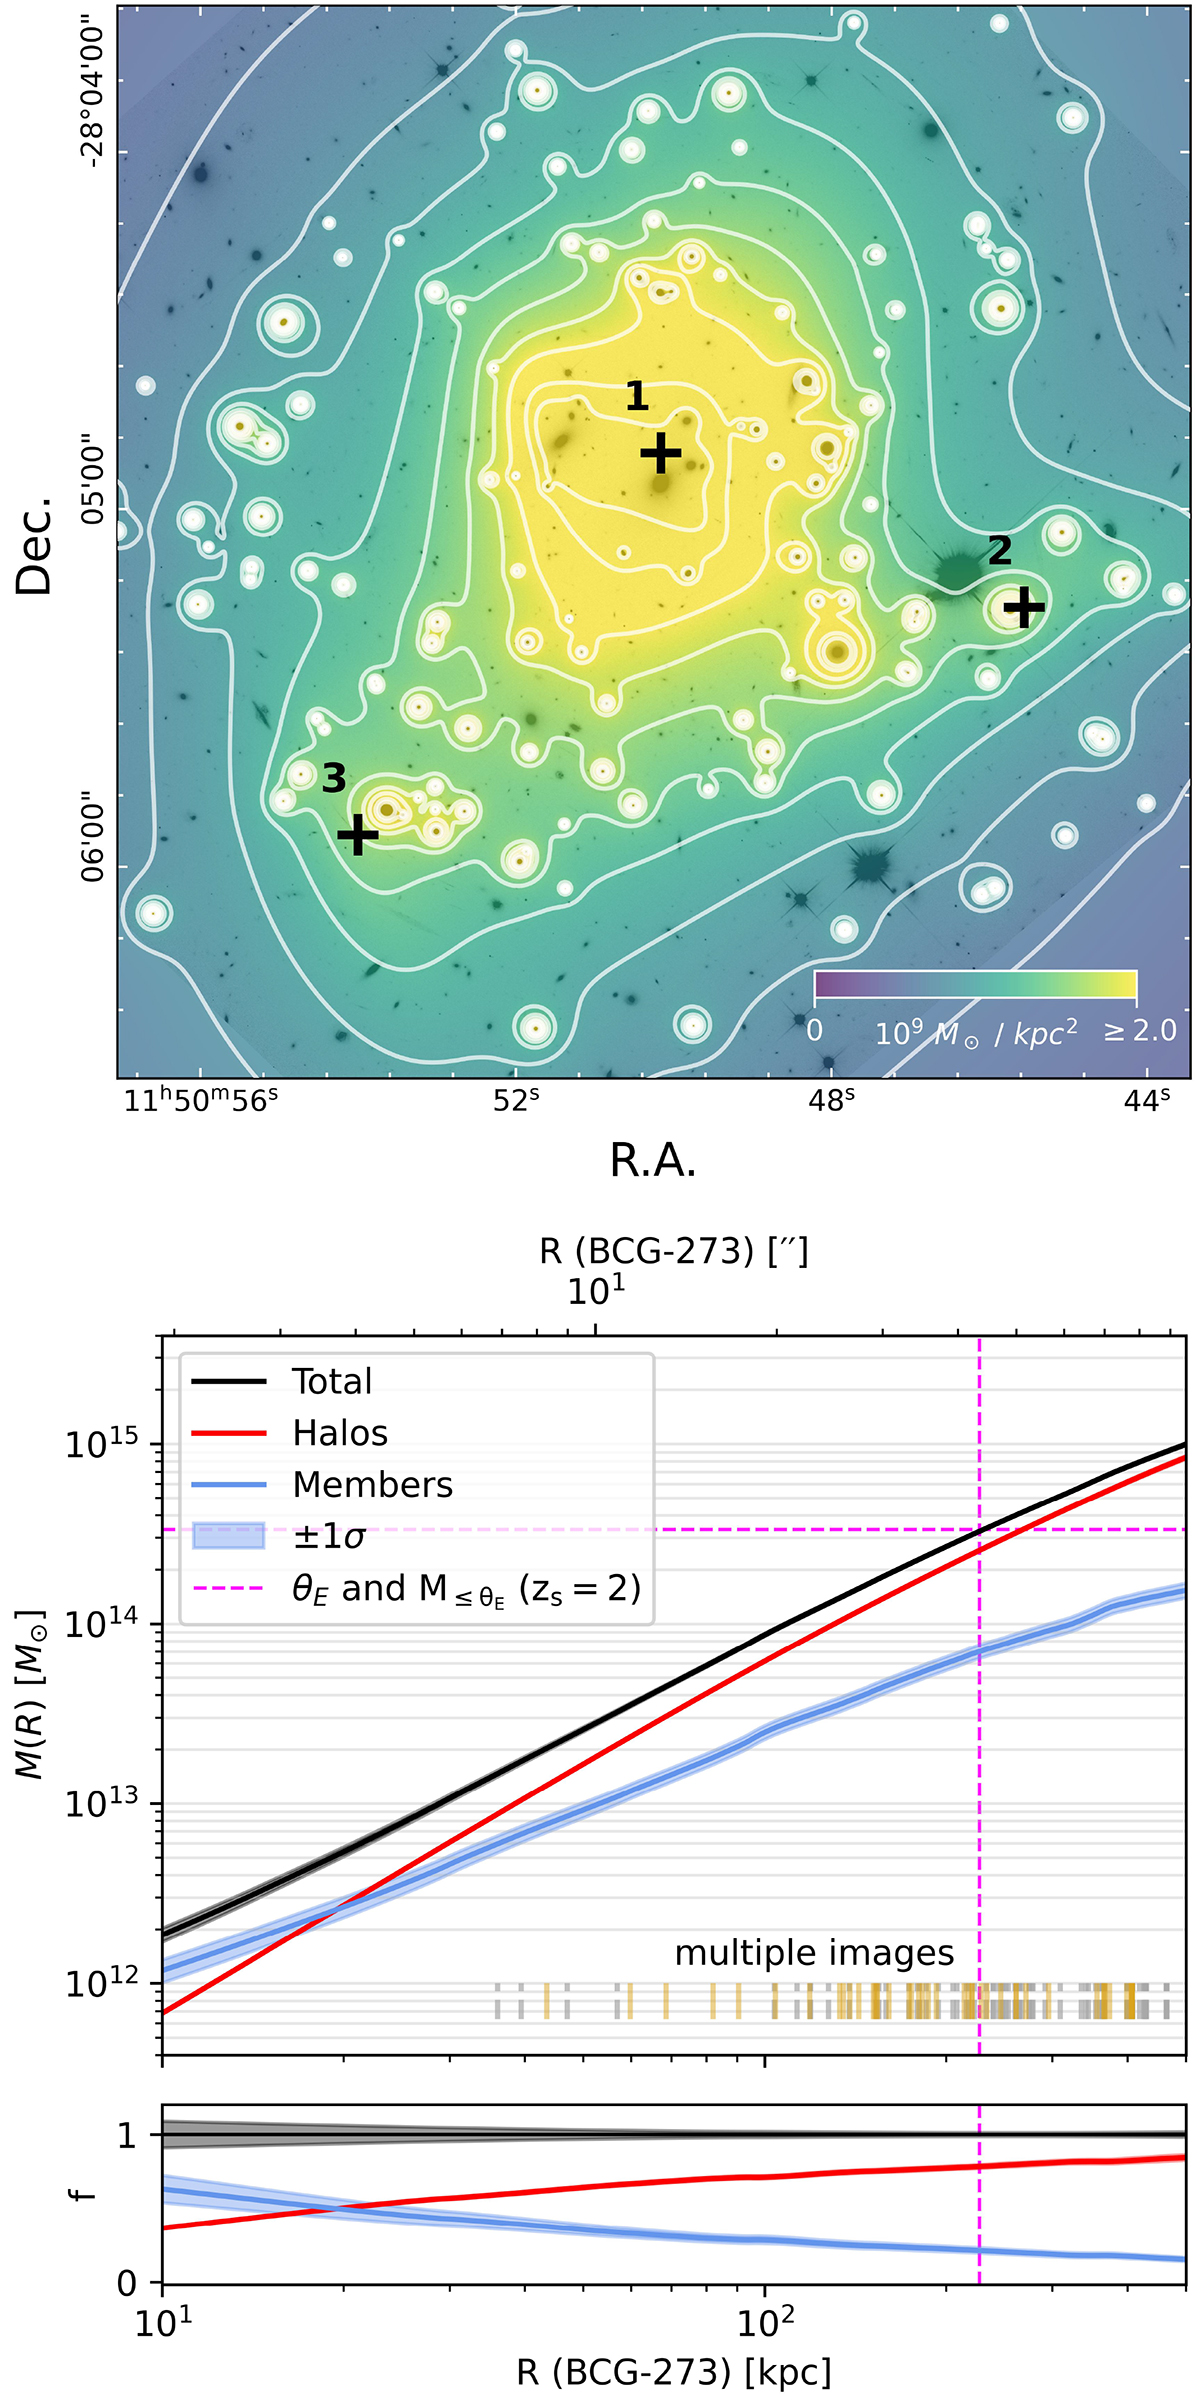
Fig. 6.
Download original image
Total projected mass distribution in units of 109 M⊙ kpc−2 and the central position of the three cluster halos (black + markers), overlaid onto an F814W image (upper panel) and cumulative total median mass profile as a function of the distance R from the BCG 273 (middle panel). Vertical lines mark the radial distance of the multiple images: the golden sample used to optimize the lens model is indicated in gold and other multiple images are indicated by the gray dashed lines. Cumulative mass profiles for the cluster members, including the two BCGs, (in blue), and for the cluster halos (in red) are also shown, along with their ratio with the total mass profile (lower panel). The shaded area indicates, for each mass component, the ±1σ interval. Magenta dashed lines indicate the cluster Einstein radius (θE) and the total mass enclosed by the corresponding critical curve (ME) for a source at a redshift of zs = 2.
Current usage metrics show cumulative count of Article Views (full-text article views including HTML views, PDF and ePub downloads, according to the available data) and Abstracts Views on Vision4Press platform.
Data correspond to usage on the plateform after 2015. The current usage metrics is available 48-96 hours after online publication and is updated daily on week days.
Initial download of the metrics may take a while.