Fig. 5.
Download original image
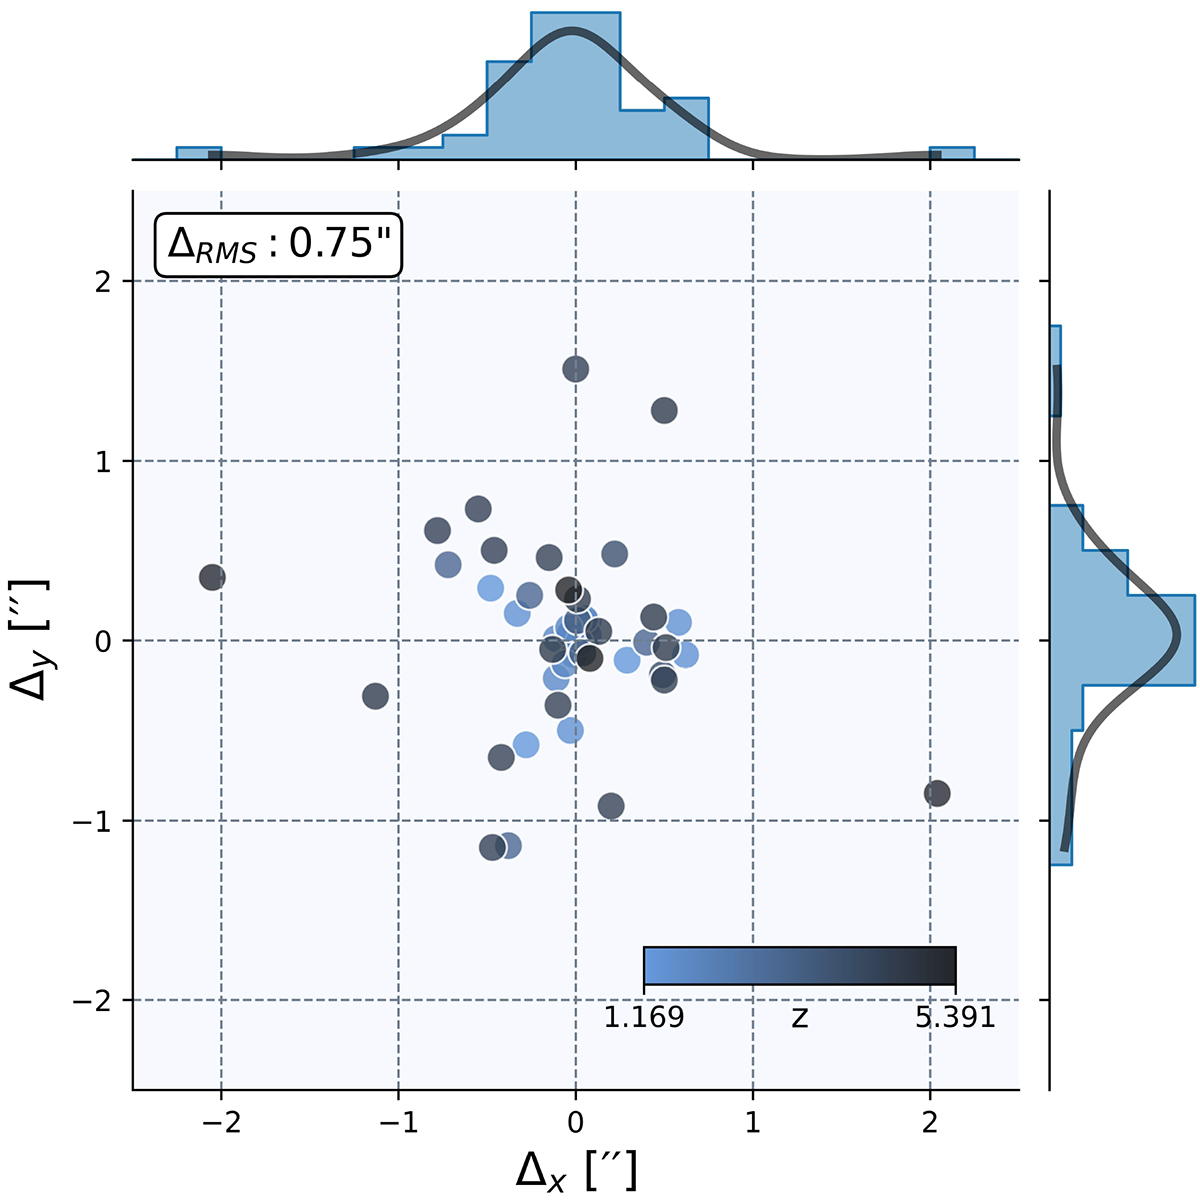
Distribution of the displacement in the image plane, in arcseconds, along the x and y axes between the observed and model-predicted positions of multiple images in the golden sample. The color of the points indicates the redshift of the objects. The histograms are the marginal distributions of the displacements, computed using ten bins of width 0.25″, and the solid black lines are their kernel density estimates. The displacement root mean square (RMS) is ΔRMS = 0.75″.
Current usage metrics show cumulative count of Article Views (full-text article views including HTML views, PDF and ePub downloads, according to the available data) and Abstracts Views on Vision4Press platform.
Data correspond to usage on the plateform after 2015. The current usage metrics is available 48-96 hours after online publication and is updated daily on week days.
Initial download of the metrics may take a while.