Fig. B.1.
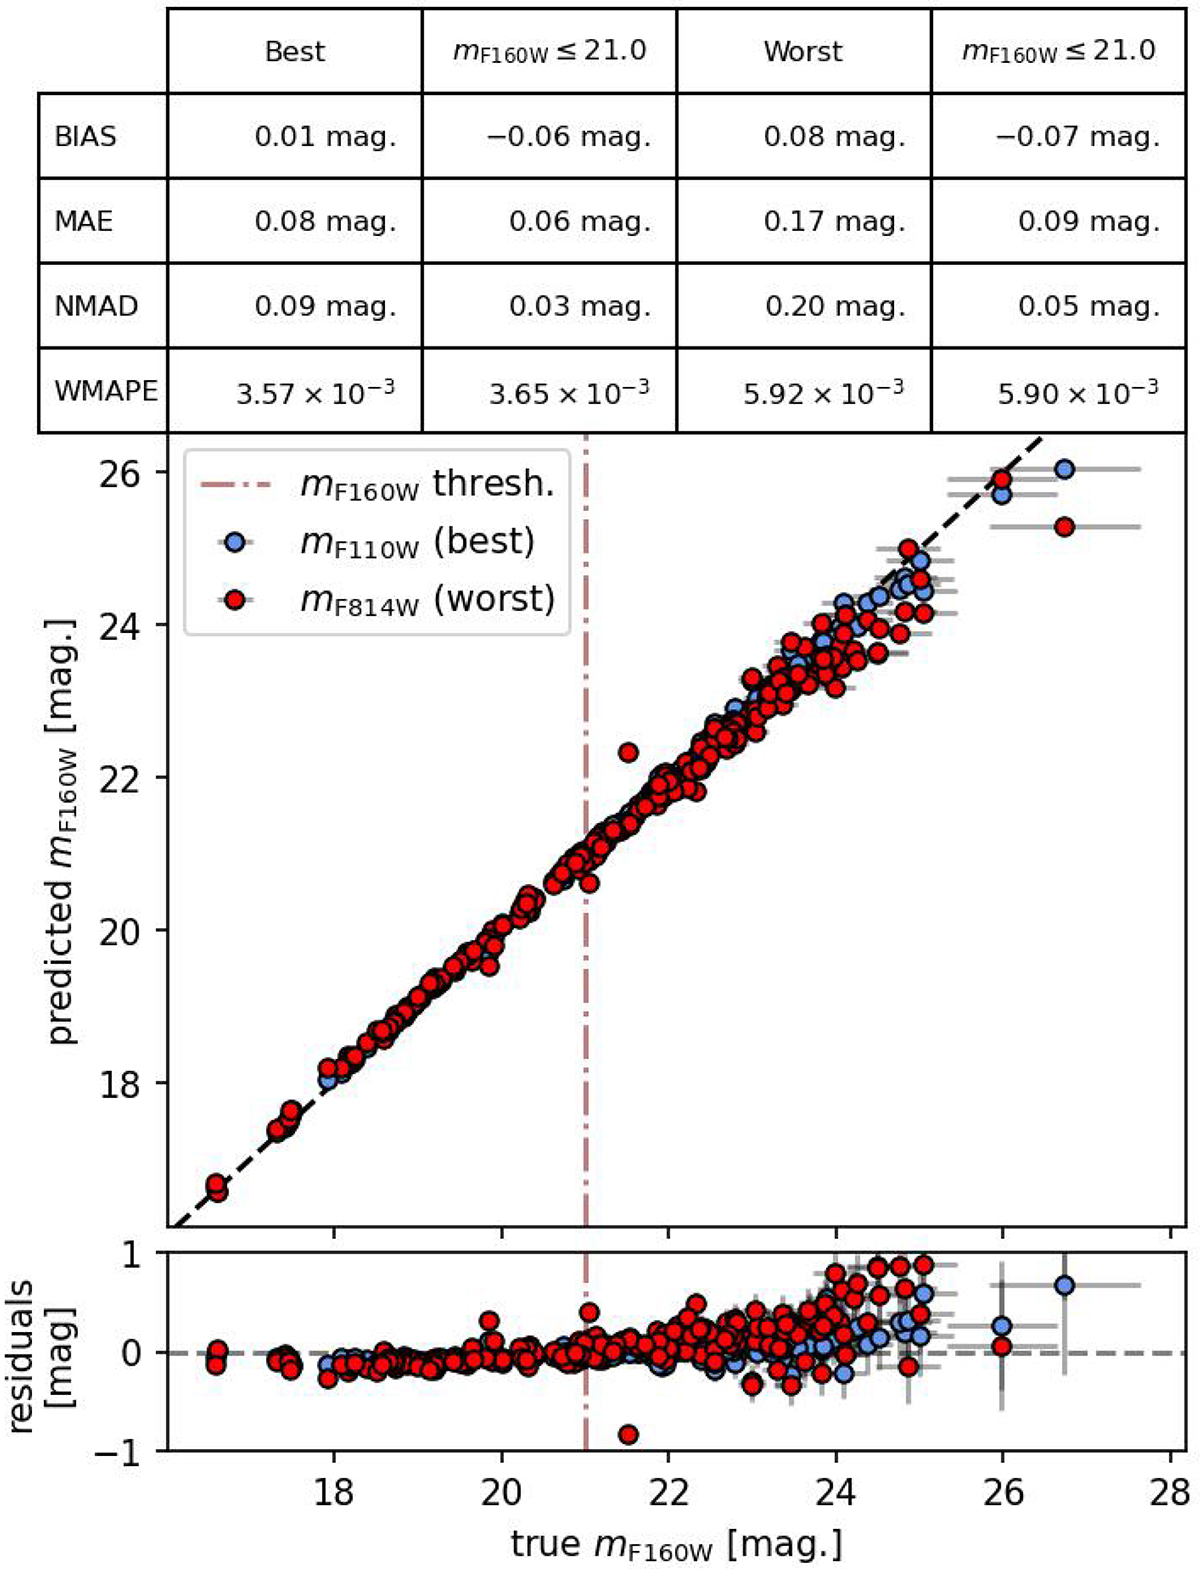
Download original image
True versus predicted Kron magnitudes mF160W plots (upper panel) and residuals (lower panel) for 222 spectroscopic cluster members. The predicted values were obtained using two linear regressors trained using Kron magnitudes, mF110W and mF814W, (red and blue points, respectively). The brown dash-dotted line indicates the magnitude threshold used to select the cluster members sample used for the strong-lensing model. The table shows various statistical indicators for the best and worst regressor, considering all the values (first and third column) or only the objects for which mF160W ≤ 21 (second and last column).
Current usage metrics show cumulative count of Article Views (full-text article views including HTML views, PDF and ePub downloads, according to the available data) and Abstracts Views on Vision4Press platform.
Data correspond to usage on the plateform after 2015. The current usage metrics is available 48-96 hours after online publication and is updated daily on week days.
Initial download of the metrics may take a while.