Fig. 8

Download original image
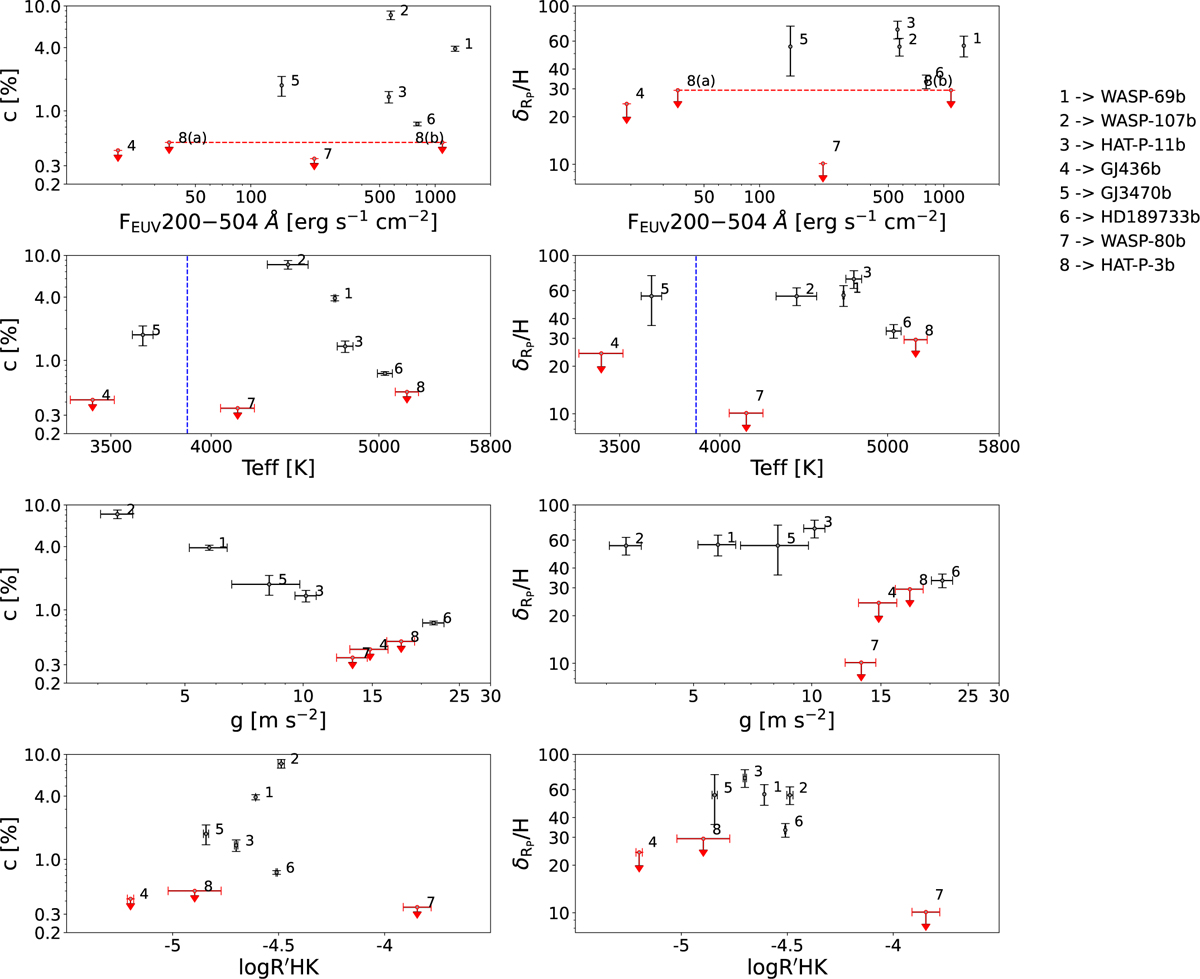
Correlation plots. Targets are from this work, Guilluy et al. (2020, 2023), and Fossati et al. (2022). Contrast c (left panels) and ![]() (right panels) as a function of the EUV flux in the 200–504 Å range, effective temperature and planetary gravity, and log R′HK. Red markers indicate targets with only an upper limit on the He I detection (reported at 1σ). The vertical dashed blue lines in the effective temperature diagrams indicate the transition from M-type to K-type stars. The dashed horizontal line connects the two possible locations for HAT-P-3b (for the two different coronal temperatures).
(right panels) as a function of the EUV flux in the 200–504 Å range, effective temperature and planetary gravity, and log R′HK. Red markers indicate targets with only an upper limit on the He I detection (reported at 1σ). The vertical dashed blue lines in the effective temperature diagrams indicate the transition from M-type to K-type stars. The dashed horizontal line connects the two possible locations for HAT-P-3b (for the two different coronal temperatures).
Current usage metrics show cumulative count of Article Views (full-text article views including HTML views, PDF and ePub downloads, according to the available data) and Abstracts Views on Vision4Press platform.
Data correspond to usage on the plateform after 2015. The current usage metrics is available 48-96 hours after online publication and is updated daily on week days.
Initial download of the metrics may take a while.


