Open Access
Fig. 2.
Download original image
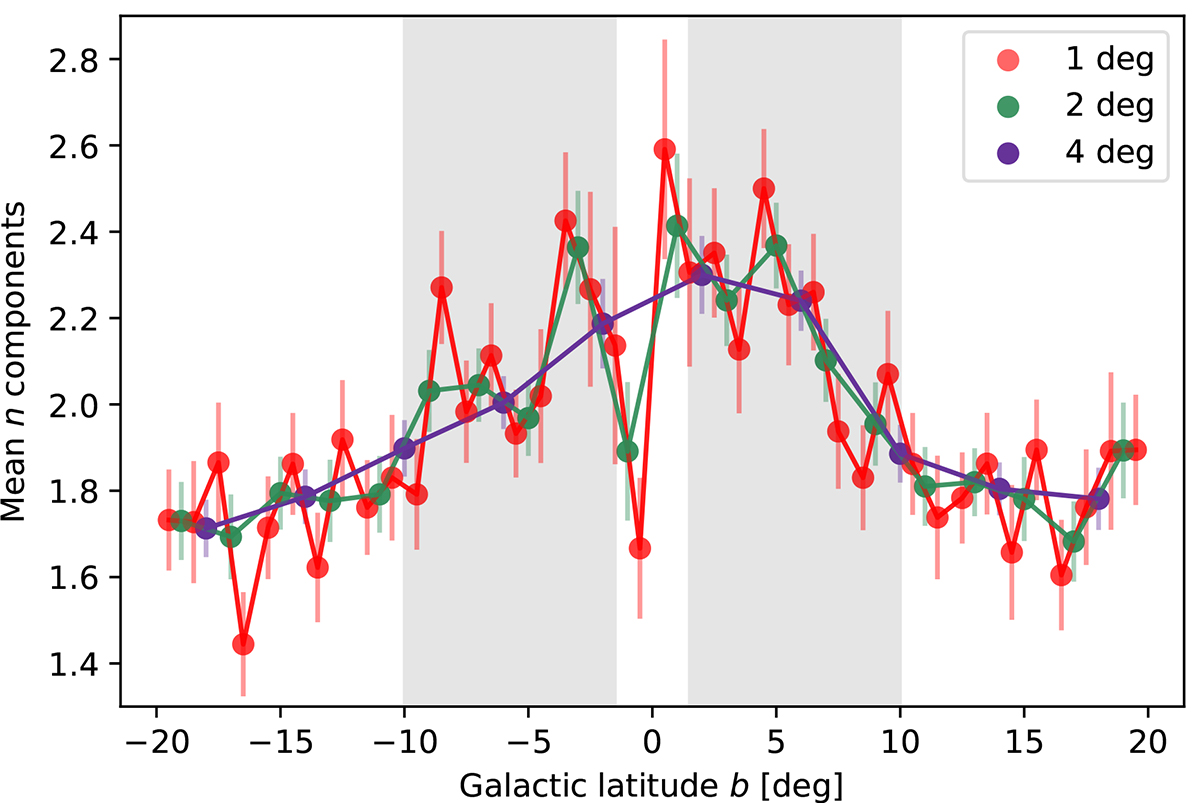
Mean number of fitted polarised components for sources in the SPASS/ATCA RM catalogue, as a function of Galactic latitude. The different colours indicate different latitude bins. The grey, shaded regions indicate the latitude range of our observations.
Current usage metrics show cumulative count of Article Views (full-text article views including HTML views, PDF and ePub downloads, according to the available data) and Abstracts Views on Vision4Press platform.
Data correspond to usage on the plateform after 2015. The current usage metrics is available 48-96 hours after online publication and is updated daily on week days.
Initial download of the metrics may take a while.