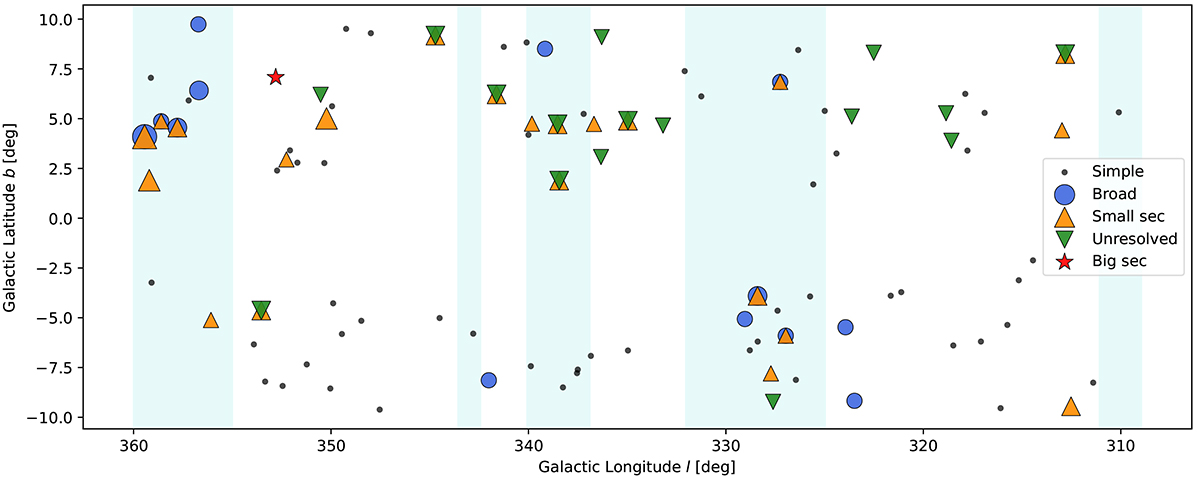
Fig. 16.
Download original image
Spatial distribution of sources, colourised by their Faraday complexity classification, as described in Sect. 5.2.1. The cyan-shaded regions show longitudes that correspond to the Galactic spiral arms listed in the text and the longitude range within 5 degrees of the Galactic centre. The Faraday simple sources are plotted as black dots. The size of the markers for Faraday complex sources is scaled according to the number of QU-fitted components.
Current usage metrics show cumulative count of Article Views (full-text article views including HTML views, PDF and ePub downloads, according to the available data) and Abstracts Views on Vision4Press platform.
Data correspond to usage on the plateform after 2015. The current usage metrics is available 48-96 hours after online publication and is updated daily on week days.
Initial download of the metrics may take a while.