Fig. 11.
Download original image
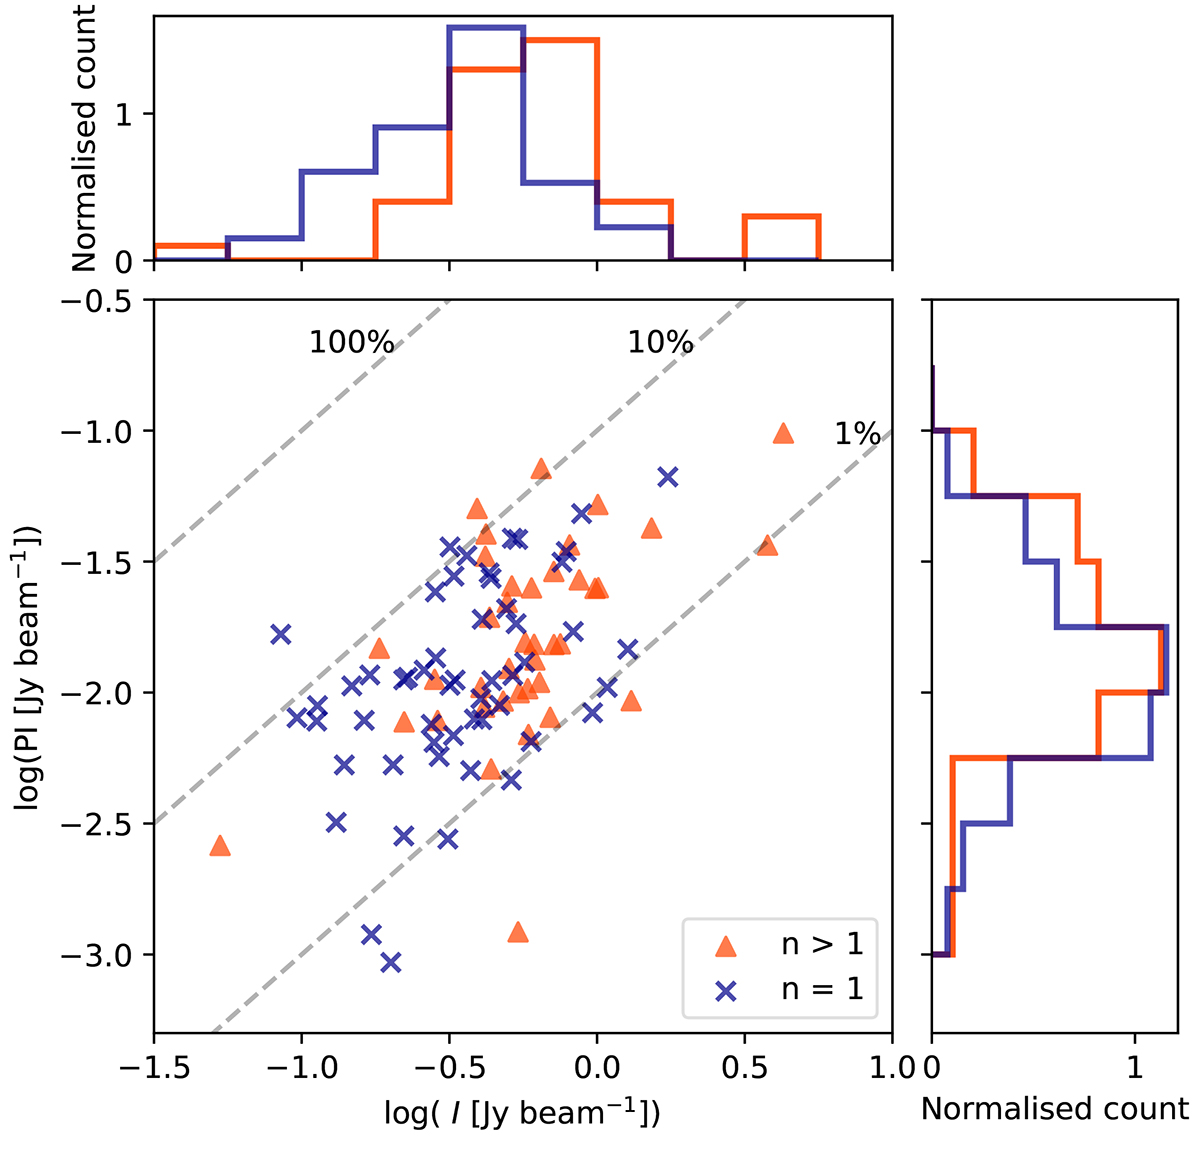
Scatter plot of the polarised intensity and the MFS total intensity flux densities. Faraday simple sources are plotted as blue crosses and Faraday complex sources are plotted as orange triangles. The grey dashed lines represent constant fractional polarisation, labelled as a percentage. The histograms above (to the right of) the plot shows the distribution of the total intensity (polarised intensity flux densities) for the Faraday simple and complex sources, in blue and orange, respectively.
Current usage metrics show cumulative count of Article Views (full-text article views including HTML views, PDF and ePub downloads, according to the available data) and Abstracts Views on Vision4Press platform.
Data correspond to usage on the plateform after 2015. The current usage metrics is available 48-96 hours after online publication and is updated daily on week days.
Initial download of the metrics may take a while.