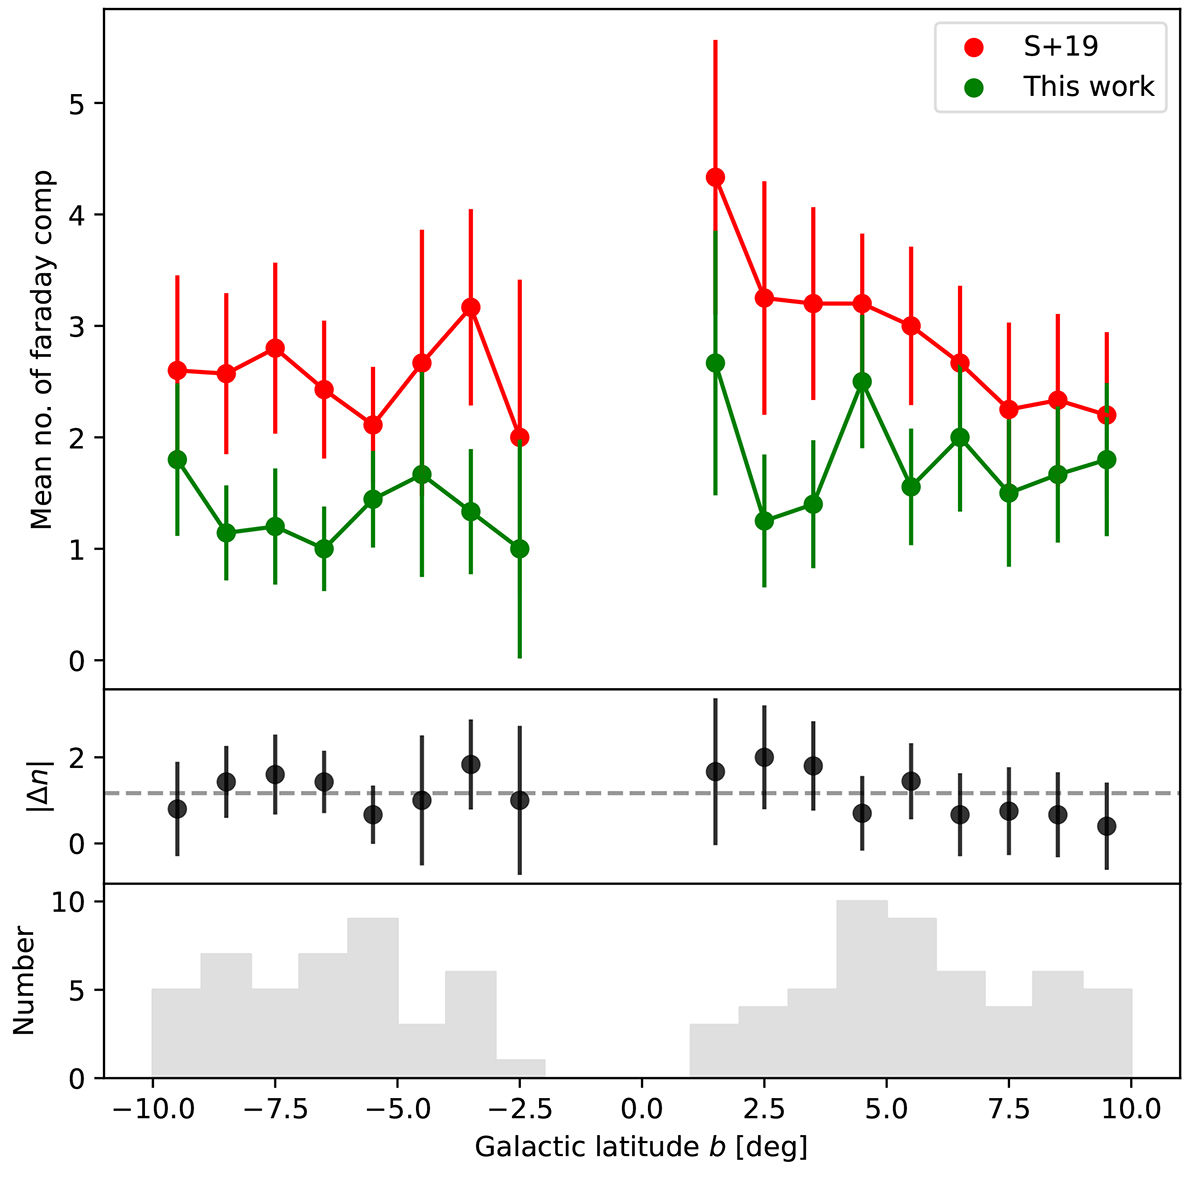
Fig. 10.
Download original image
Average number of fitted Faraday components of the observed sources (green) and the same sources from S19 (red) as a function of Galactic latitude. The errorbars are Poisson uncertainties. The central panel shows the difference in the average number of components per bin between this work and S19. The mean difference (|Δn| = 1.1 ± 0.1) is plotted as the dashed line. The bottom panel shows the number of sources in each 1-degree bin.
Current usage metrics show cumulative count of Article Views (full-text article views including HTML views, PDF and ePub downloads, according to the available data) and Abstracts Views on Vision4Press platform.
Data correspond to usage on the plateform after 2015. The current usage metrics is available 48-96 hours after online publication and is updated daily on week days.
Initial download of the metrics may take a while.