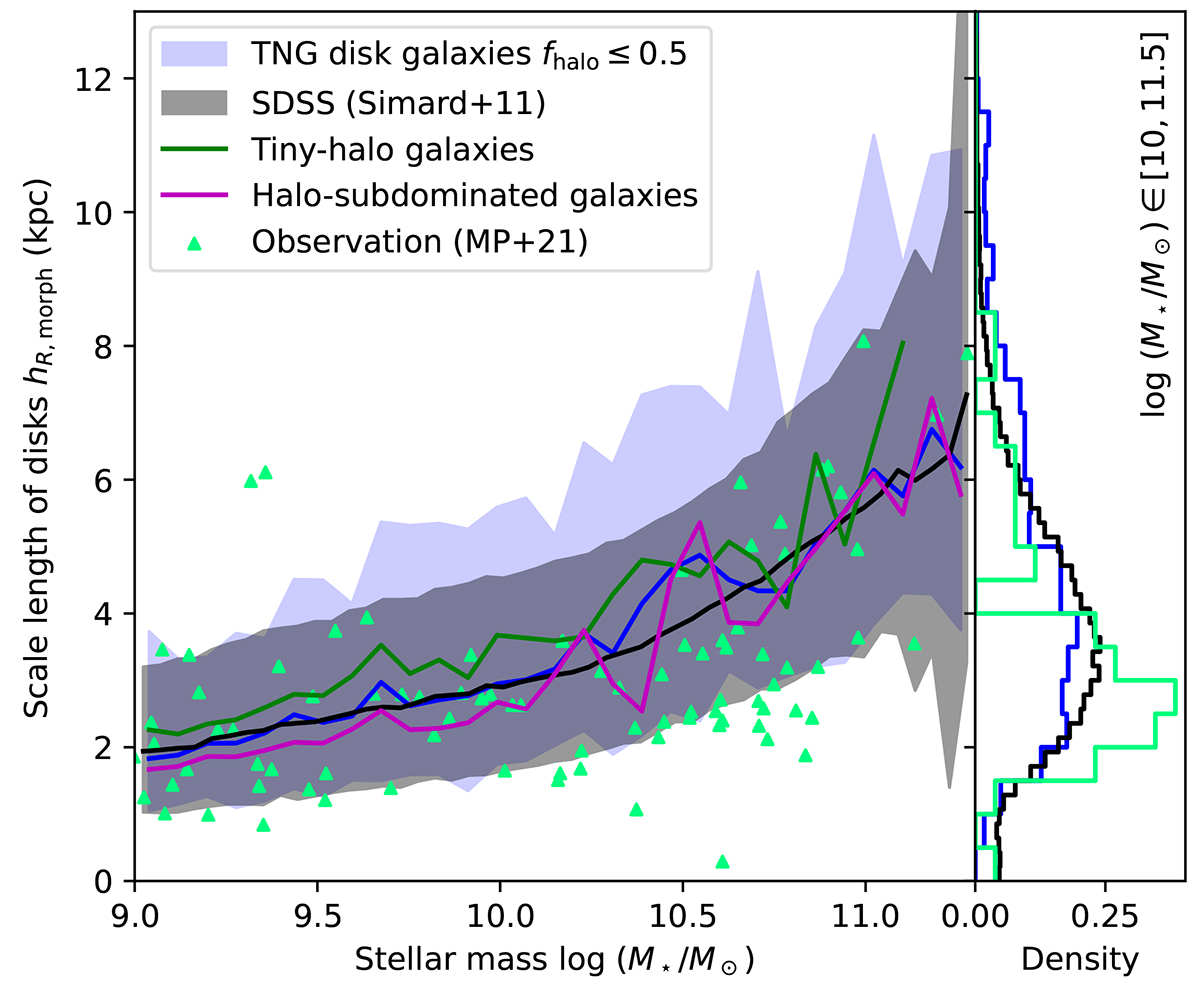
Fig. 5.
Download original image
Mass–hR, morph diagram. Disk galaxies from TNG50 are represented by the blue-shaded area, while observed disk galaxies from SDSS DR7 are shown in the gray-shaded region. The solid profiles are the median. The shaded areas denote the 1σ envelope, representing the 16th and 84th percentiles. For the SDSS data, we used scale-length values from Simard et al. (2011) and stellar-mass data from Mendel et al. (2014). It is apparent that SDSS galaxies are consistent with TNG50 disk galaxies, and the difference between halo-subdominated galaxies and tiny-halo galaxies is minimal. The green triangles and the histograms on the right illustrate that the data utilized in Mancera Piña et al. (2021, green) are biased towards smaller-sized galaxies.
Current usage metrics show cumulative count of Article Views (full-text article views including HTML views, PDF and ePub downloads, according to the available data) and Abstracts Views on Vision4Press platform.
Data correspond to usage on the plateform after 2015. The current usage metrics is available 48-96 hours after online publication and is updated daily on week days.
Initial download of the metrics may take a while.