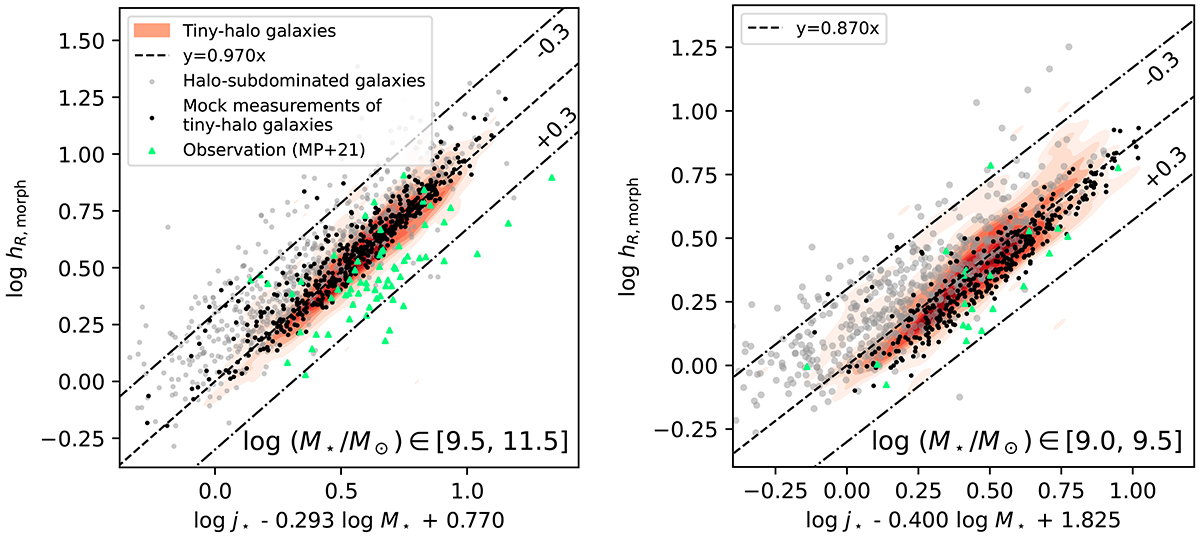
Fig. 4.
Download original image
The j⋆ − M⋆ − hR, morph relation comparing simulations with observations. The units of hR, morph, j⋆, and M⋆ are kpc, kpc km s−1, and M⊙, respectively. The left and right panels show galaxies in two mass ranges log (M⋆/M⊙): ∈[9.5, 11.5] and ∈[9.0, 9.5]. The fiducial j⋆ − M⋆ − hR, morph relation of tiny-halo galaxies, where hR, morph represents the scale length of the disk component defined by morphology, is visualized using a kernel density estimation (KDE) map. For convenience, we adjust the surface fitting to align with y = x. We performed mock measurements of tiny-halo galaxies based on Eq. (2) (black dots). The gray points show the halo-subdominated galaxies for comparison. The observational data points of disk galaxies from Mancera Piña et al. (2021) are represented by green triangles. The dot-dashed lines represent the cases exhibiting offsets of ±0.3 dex.
Current usage metrics show cumulative count of Article Views (full-text article views including HTML views, PDF and ePub downloads, according to the available data) and Abstracts Views on Vision4Press platform.
Data correspond to usage on the plateform after 2015. The current usage metrics is available 48-96 hours after online publication and is updated daily on week days.
Initial download of the metrics may take a while.